Cryptocurrency Market Analysis and Predictions
암호화폐 시장 분석 및 예측
In recent weeks, the cryptocurrency market has experienced a decline in gains, primarily attributed to SEC-related processes. The delay in Ethereum ETF applications has exerted selling pressure on Ethereum and numerous altcoin projects. We analyze potential outcomes for Pepe and Arweave through detailed chart analysis and key levels.
최근 몇 주 동안 암호화폐 시장은 주로 SEC 관련 프로세스로 인해 이익 감소를 경험했습니다. 이더리움 ETF 신청이 지연되면서 이더리움과 수많은 알트코인 프로젝트에 매도 압력이 가해졌습니다. 상세한 차트 분석과 주요 수준을 통해 Pepe와 Arweave의 잠재적 결과를 분석합니다.
Pepe Chart Analysis
페페 차트 분석
Pepe has exhibited a steady recovery in recent days, suggesting continued purchases at lower levels. Its price movement has formed an inverse head-and-shoulders pattern, which will be validated by a breakout above $0.0000092. If buyers sustain the price above the neckline, the PEPE/USDT pair may extend its uptrend. The bullish setup's formation target is $0.0000145.
Pepe는 최근 며칠 동안 꾸준한 회복세를 보였으며 이는 낮은 수준에서 지속적인 구매를 시사합니다. 가격 움직임은 역헤드앤숄더 패턴을 형성했으며, 이는 $0.0000092 이상의 돌파로 검증됩니다. 구매자가 네크라인 위에서 가격을 유지한다면 PEPE/USDT 쌍은 상승 추세를 연장할 수 있습니다. 강세 설정의 형성 목표는 $0.0000145입니다.
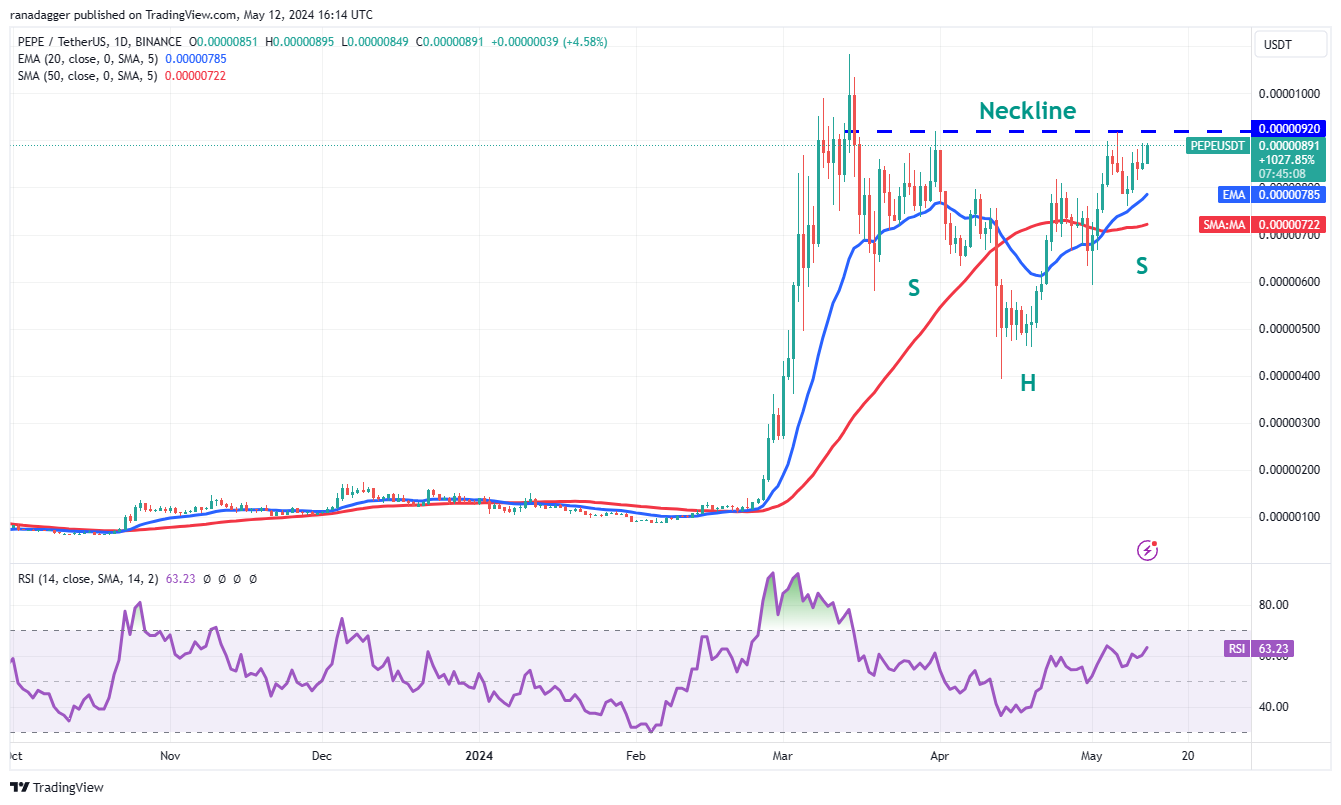
Moving averages are anticipated to provide robust support during pullbacks. A recovery above the moving averages will signal positive sentiment and ongoing dip buying. However, a breach of the $0.0000060 support could shift the trend negatively in the short term.
이동 평균은 하락 기간 동안 강력한 지원을 제공할 것으로 예상됩니다. 이동평균선 위로 회복되면 긍정적인 심리와 지속적인 하락세 매수 신호가 될 것입니다. 그러나 $0.0000060 지원을 위반하면 단기적으로 추세가 부정적으로 바뀔 수 있습니다.
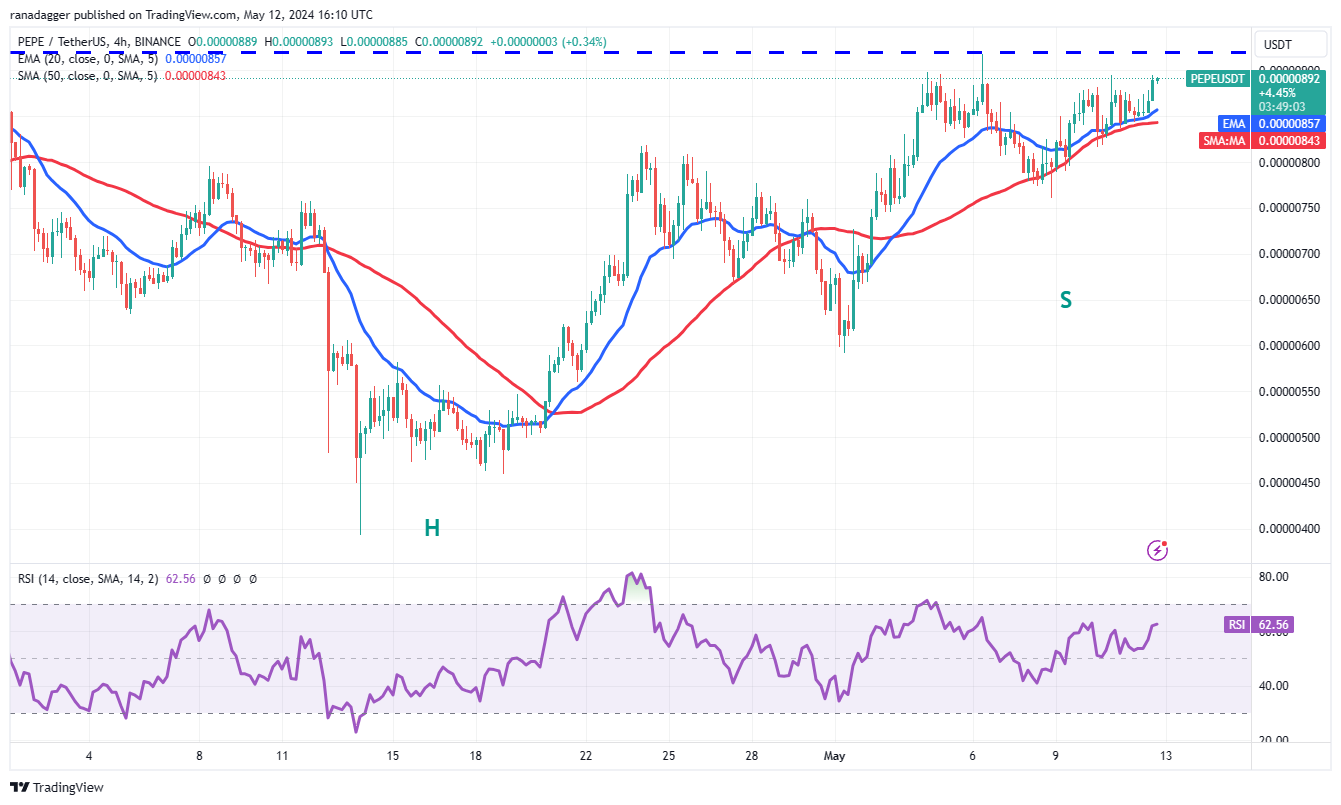
The 4-hour chart reveals support at moving averages, indicating that bulls are defending this level tenaciously. Buyers aim to overcome the $0.0000092 resistance. A price decline and breach below the moving averages would suggest a bearish resurgence. The price may then decline to the critical support at $0.0000076, where bulls are likely to initiate significant buying.
4시간 차트는 이동 평균의 지지를 보여주며 상승세가 이 수준을 끈질기게 방어하고 있음을 나타냅니다. 구매자는 $0.0000092 저항을 극복하는 것을 목표로 합니다. 가격이 하락하고 이동 평균을 밑돌면 약세의 부활을 암시합니다. 그런 다음 가격은 $0.0000076의 중요한 지지선까지 하락할 수 있으며, 여기서 강세는 상당한 매수를 시작할 가능성이 높습니다.
Arweave Chart Analysis
Arweave 차트 분석
Arweave (AR) has been trending upward over the past few days, demonstrating strong bullish momentum. The rising 20-day EMA at $36 and RSI above 61 indicate bullish dominance. The AR/USDT pair could encounter a significant resistance level at $47.51. If bulls drive the price above this resistance, the pair may surge towards $52 and subsequently $68.
Arweave(AR)는 지난 며칠 동안 상승 추세를 보이며 강력한 강세 모멘텀을 보여주었습니다. 20일 EMA가 $36로 상승하고 RSI가 61 이상으로 상승하면 강세를 나타냅니다. AR/USDT 쌍은 $47.51에서 상당한 저항 수준에 직면할 수 있습니다. 황소가 이 저항선 위로 가격을 끌어올리면 쌍은 52달러로 급등할 수 있으며 이후에는 68달러로 급등할 수 있습니다.
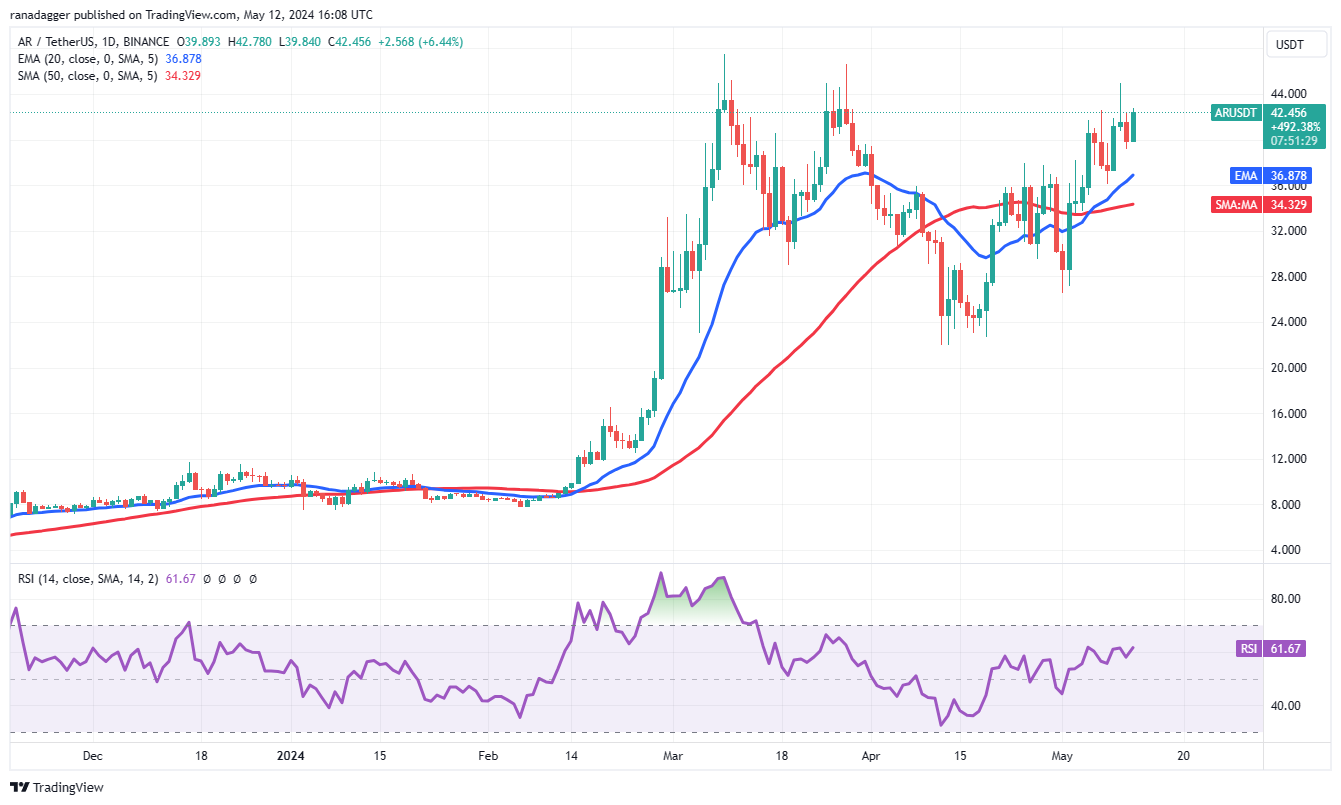
Should the pair retrace and break below the moving averages, this positive outlook could be invalidated in the near term, potentially leading to a decline towards $26.50.
통화 쌍이 이동 평균 아래로 되돌아가서 돌파할 경우 이러한 긍정적인 전망은 단기적으로 무효화되어 잠재적으로 $26.50까지 하락할 수 있습니다.
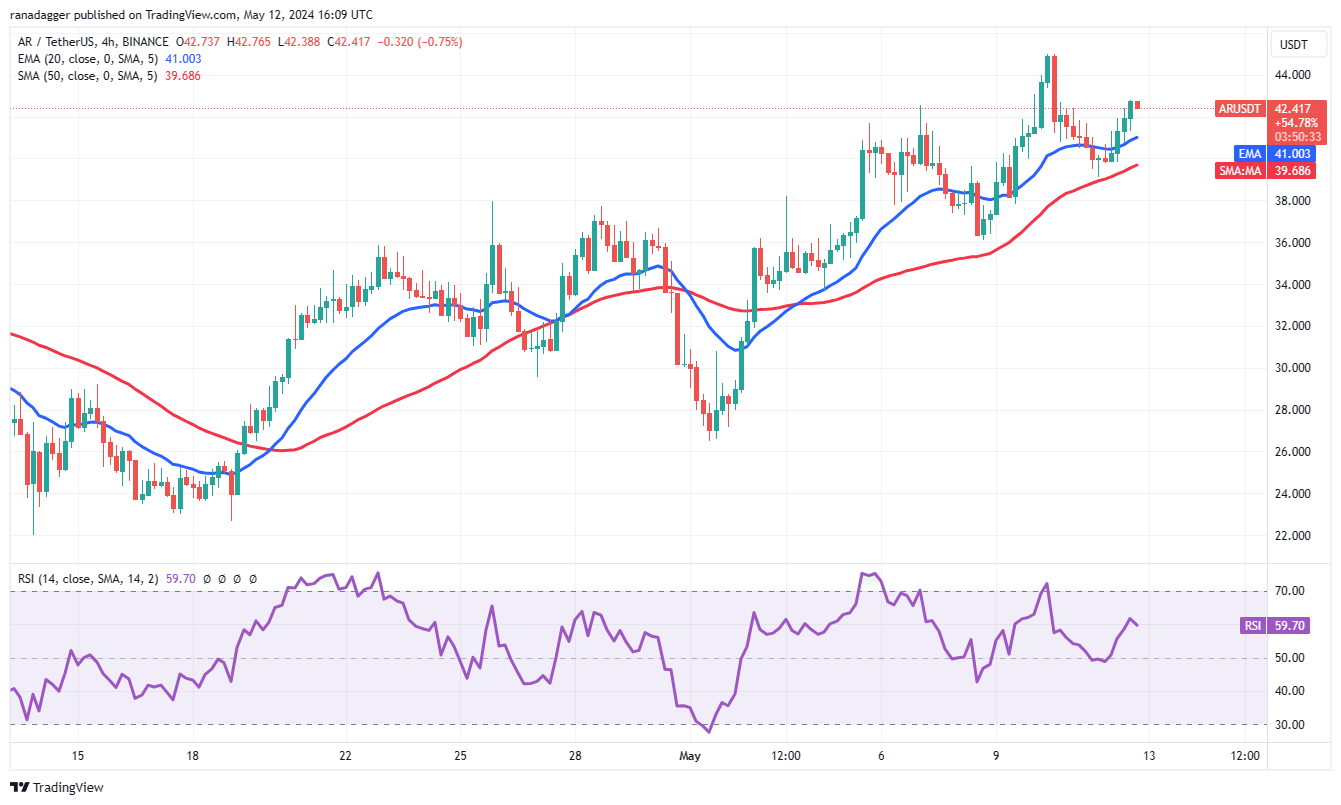
The 4-hour chart indicates support at the SMA 50 during pullbacks. Buyers will attempt to elevate the price to $45 and then $47.51. Sellers are anticipated to mount a strong defense in this area, as failure to do so could accelerate the upward momentum.
4시간 차트는 하락 중 SMA 50의 지지를 나타냅니다. 구매자는 가격을 $45, $47.51로 인상하려고 시도할 것입니다. 매도자들은 이 분야에서 강력한 방어를 펼칠 것으로 예상된다. 그렇게 하지 않으면 상승 모멘텀이 가속화될 수 있기 때문이다.
The SMA 50 is a crucial support to monitor in the event of a bearish reversal. If this level breaks, the pair could decline to $36 and then to $34. The price may recover from this region but is likely to face selling pressure at the EMA 20.
SMA 50은 약세 반전이 발생할 경우 모니터링하는 데 중요한 지원입니다. 이 수준이 무너지면 통화쌍은 36달러로 하락한 다음 34달러로 하락할 수 있습니다. 이 지역에서 가격이 회복될 수 있지만 EMA 20에서는 매도 압력에 직면할 가능성이 높습니다.


 BlockchainReporter
 Cryptopolitan_News
 DogeHome
 Crypto Intelligence
 Bitcoin Sistemi EN
 CoinsProbe
 CryptoPotato_News
 CoinsProbe
 DogeHome


