Amid the burgeoning bullish market, Dogecoin maintains its bullish trajectory and poised for a breakout. With buyers keeping the price afloat above the $0.40 mark, the likelihood of a bullish trend has escalated.
As the broader market experiences a resurgence, DOGE could witness an upsurge beyond the $0.50 psychological threshold. Will the renowned meme coin overcome this barrier? Our latest price analysis sheds light on this question.
Dogecoin Price Analysis
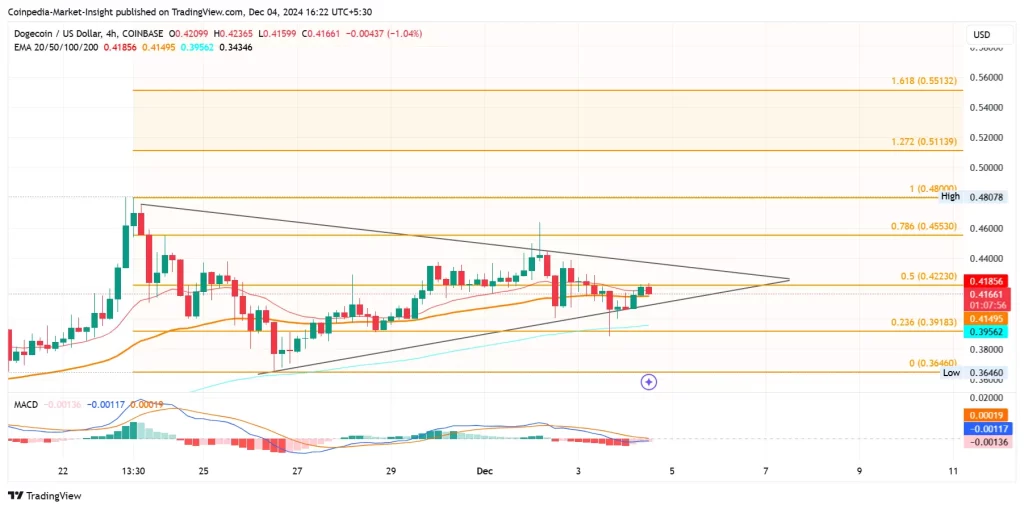
The 4-hour chart exhibits a triangle pattern formation in the DOGE price action. This consolidation between converging trend lines follows a significant surge.
Over the past month, DOGE has yielded impressive returns, fueling the memecoin's rally. The bullish momentum has resulted in a price increase of approximately 175% during that period.

Tradingview
Presently, DOGE demonstrates a bounce from the support trend line, forming two consecutive bullish candles. However, it faces resistance at the 50% Fibonacci level ($0.423).
A 1.04% pullback in the last 4 hours reflects supply pressure and the crucial Fibonacci resistance hindering bullish growth. Nonetheless, a brief recovery rally has led to a convergence of the MACD and signal lines.
The indicator suggests a potential bullish crossover if the uptrend persists. A breakout above the 50% Fibonacci level could challenge the resistance trendline and attempt to break the triangle pattern.
Dogecoin Targets $0.50 Breakout
Based on Fibonacci levels, the triangle breakout rally will test the 78.60% Fibonacci level at $0.4553.
The 52-week high currently stands at $0.48078, and the breakout rally could extend to the 1.272 Fibonacci level at $0.5113. This would establish a new 52-week high for DOGE and surpass the $0.50 psychological mark.
Conversely, a breakdown below the local support trend line could probe the 23.60% Fibonacci level at $0.39183. The rising 50 and 100 EMA lines in the 4-hour chart provide dynamic support.
FAQs
What is Dogecoin's current price trend?
Dogecoin consolidates within a triangle pattern and rallies from the support trend line. It grapples with the 50% Fibonacci level at $0.423.
What are the resistance and support levels for Dogecoin?
Resistance exists at the 50% Fibonacci level ($0.423), with targets at $0.4553 and $0.5113. Key support is found at $0.39183 and the ascending 50 and 100 EMA lines.
What are the chances of Dogecoin surpassing $0.50?
A breakout from the triangle pattern, supported by positive technical indicators and rising EMA lines, could propel DOGE above $0.50, potentially reaching $0.5113.


 DogeHome
 The Bit Journal
 BlockchainReporter
 Optimisus
 CFN
CFN Coincu
 Cryptopolitan_News


