Amid the burgeoning bullish market, Dogecoin maintains its bullish trajectory and poised for a breakout. With buyers keeping the price afloat above the $0.40 mark, the likelihood of a bullish trend has escalated.
在蓬勃發展的牛市中,狗狗幣保持其看漲軌跡並準備突破。由於買家將價格維持在 0.40 美元以上,看漲趨勢的可能性已經上升。
As the broader market experiences a resurgence, DOGE could witness an upsurge beyond the $0.50 psychological threshold. Will the renowned meme coin overcome this barrier? Our latest price analysis sheds light on this question.
隨著大盤經歷復甦,DOGE 可能會突破 0.50 美元的心理門檻。著名的迷因幣會克服這個障礙嗎?我們最新的價格分析揭示了這個問題。
Dogecoin Price Analysis
狗狗幣價格分析
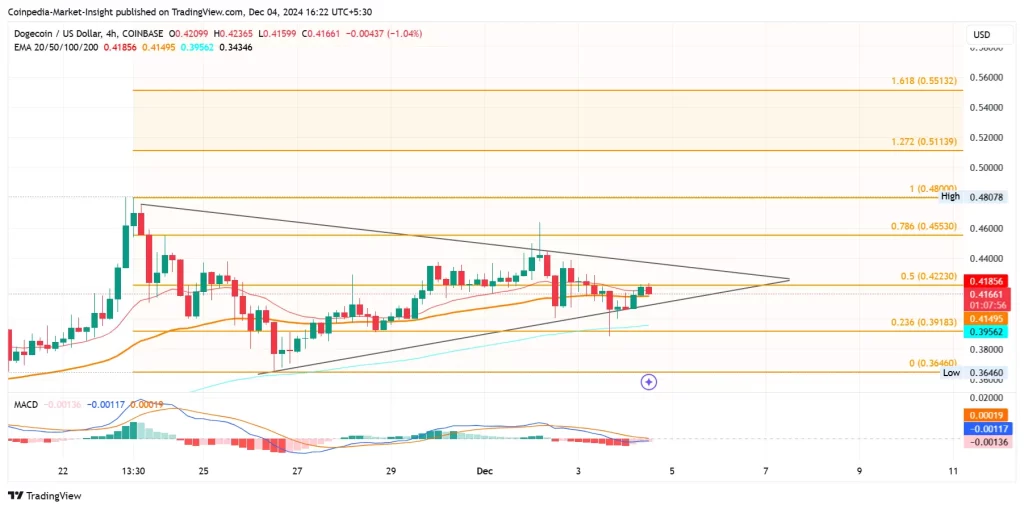
The 4-hour chart exhibits a triangle pattern formation in the DOGE price action. This consolidation between converging trend lines follows a significant surge.
4 小時圖展示了 DOGE 價格走勢的三角形形態。趨同趨勢線之間的整合是在大幅上漲之後進行的。
Over the past month, DOGE has yielded impressive returns, fueling the memecoin's rally. The bullish momentum has resulted in a price increase of approximately 175% during that period.
在過去的一個月裡,DOGE 產生了令人印象深刻的回報,推動了 memecoin 的上漲。在此期間,看漲勢頭導致價格上漲約 175%。

Tradingview
交易視圖
Presently, DOGE demonstrates a bounce from the support trend line, forming two consecutive bullish candles. However, it faces resistance at the 50% Fibonacci level ($0.423).
目前,DOGE從支撐趨勢線反彈,形成兩根連續看漲蠟燭。然而,它面臨 50% 斐波那契水平(0.423 美元)的阻力。
A 1.04% pullback in the last 4 hours reflects supply pressure and the crucial Fibonacci resistance hindering bullish growth. Nonetheless, a brief recovery rally has led to a convergence of the MACD and signal lines.
過去 4 小時內 1.04% 的回檔反映了供應壓力和阻礙看漲成長的關鍵斐波那契阻力。儘管如此,短暫的復甦反彈導致 MACD 和訊號線收斂。
The indicator suggests a potential bullish crossover if the uptrend persists. A breakout above the 50% Fibonacci level could challenge the resistance trendline and attempt to break the triangle pattern.
該指標表明,如果上升趨勢持續下去,則可能出現看漲交叉。突破 50% 斐波那契水平可能會挑戰阻力趨勢線並嘗試打破三角形形態。
Dogecoin Targets $0.50 Breakout
狗狗幣目標突破 0.50 美元
Based on Fibonacci levels, the triangle breakout rally will test the 78.60% Fibonacci level at $0.4553.
基於斐波那契水平,三角形突破反彈將測試 78.60% 斐波那契水平 0.4553 美元。
The 52-week high currently stands at $0.48078, and the breakout rally could extend to the 1.272 Fibonacci level at $0.5113. This would establish a new 52-week high for DOGE and surpass the $0.50 psychological mark.
目前52週高點為0.48078美元,突破反彈可能會延伸至1.272斐波那契水準0.5113美元。這將創下 DOGE 的 52 週新高,並突破 0.50 美元的心理關卡。
Conversely, a breakdown below the local support trend line could probe the 23.60% Fibonacci level at $0.39183. The rising 50 and 100 EMA lines in the 4-hour chart provide dynamic support.
相反,跌破本地支撐趨勢線可能會觸及 23.60% 斐波那契水準 0.39183 美元。 4小時圖中上升的50和100 EMA線提供了動態支撐。
FAQs
常見問題解答
What is Dogecoin's current price trend?
狗狗幣目前的價格走勢如何?
Dogecoin consolidates within a triangle pattern and rallies from the support trend line. It grapples with the 50% Fibonacci level at $0.423.
狗狗幣在三角形形態內盤整,並從支撐趨勢線反彈。它正在努力應對 50% 斐波那契水平,即 0.423 美元。
What are the resistance and support levels for Dogecoin?
狗狗幣的阻力位和支撐位是多少?
Resistance exists at the 50% Fibonacci level ($0.423), with targets at $0.4553 and $0.5113. Key support is found at $0.39183 and the ascending 50 and 100 EMA lines.
阻力位於 50% 斐波那契水平(0.423 美元),目標價為 0.4553 美元和 0.5113 美元。關鍵支撐位於 0.39183 美元以及上升的 50 和 100 EMA 線。
What are the chances of Dogecoin surpassing $0.50?
狗狗幣突破 0.50 美元的可能性有多大?
A breakout from the triangle pattern, supported by positive technical indicators and rising EMA lines, could propel DOGE above $0.50, potentially reaching $0.5113.
在積極的技術指標和上升的 EMA 線的支持下,突破三角形模式可能會推動 DOGE 突破 0.50 美元,有可能達到 0.5113 美元。


 The Bit Journal
 BlockchainReporter
 Optimisus
 DogeHome
 CFN
CFN Coincu
 Cryptopolitan_News
 Crypto Daily™


