Amid the burgeoning bullish market, Dogecoin maintains its bullish trajectory and poised for a breakout. With buyers keeping the price afloat above the $0.40 mark, the likelihood of a bullish trend has escalated.
急成長する強気市場の中で、ドージコインは強気の軌道を維持し、ブレイクアウトの準備を整えています。買い手が価格を0.40ドルを超えて維持していることから、強気トレンドの可能性が高まっている。
As the broader market experiences a resurgence, DOGE could witness an upsurge beyond the $0.50 psychological threshold. Will the renowned meme coin overcome this barrier? Our latest price analysis sheds light on this question.
より広範な市場が回復を経験するにつれて、DOGEは0.50ドルの心理的閾値を超える上昇を目撃する可能性があります。有名なミームコインはこの壁を乗り越えられるでしょうか?当社の最新の価格分析は、この疑問を明らかにします。
Dogecoin Price Analysis
ドージコイン価格分析
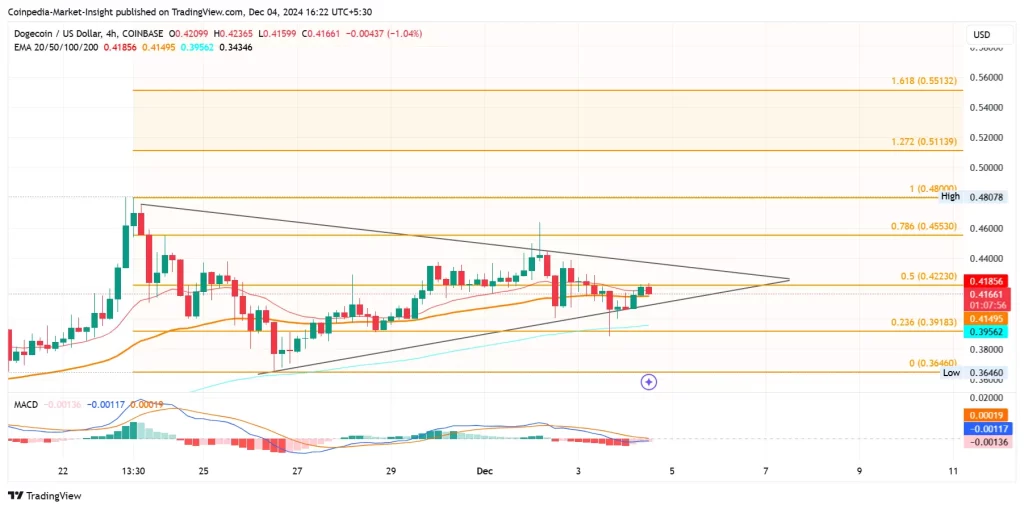
The 4-hour chart exhibits a triangle pattern formation in the DOGE price action. This consolidation between converging trend lines follows a significant surge.
4 時間足チャートは、DOGE 価格アクションで三角形のパターン形成を示しています。この収束トレンドライン間の統合は、大幅な急上昇に続きます。
Over the past month, DOGE has yielded impressive returns, fueling the memecoin's rally. The bullish momentum has resulted in a price increase of approximately 175% during that period.
過去 1 か月間、DOGE は目覚ましい利益をもたらし、ミームコインの上昇を加速させました。この強気の勢いにより、この期間中に価格は約 175% 上昇しました。

Tradingview
トレーディングビュー
Presently, DOGE demonstrates a bounce from the support trend line, forming two consecutive bullish candles. However, it faces resistance at the 50% Fibonacci level ($0.423).
現在、DOGEはサポートトレンドラインからの反発を示し、2つの連続した強気のローソク足を形成しています。しかし、50%フィボナッチレベル(0.423ドル)の抵抗に直面している。
A 1.04% pullback in the last 4 hours reflects supply pressure and the crucial Fibonacci resistance hindering bullish growth. Nonetheless, a brief recovery rally has led to a convergence of the MACD and signal lines.
過去4時間の1.04%の下落は、供給圧力と強気の成長を妨げる重要なフィボナッチ抵抗線を反映している。それにもかかわらず、短期間の回復上昇によりMACDとシグナルラインが収束しました。
The indicator suggests a potential bullish crossover if the uptrend persists. A breakout above the 50% Fibonacci level could challenge the resistance trendline and attempt to break the triangle pattern.
この指標は、上昇トレンドが続く場合、強気クロスオーバーの可能性を示唆しています。 50% フィボナッチレベルを超えるブレイクアウトは、レジスタンストレンドラインに挑戦し、トライアングルパターンのブレイクを試みる可能性があります。
Dogecoin Targets $0.50 Breakout
ドージコインは0.50ドルのブレイクアウトを目指す
Based on Fibonacci levels, the triangle breakout rally will test the 78.60% Fibonacci level at $0.4553.
フィボナッチレベルに基づくと、トライアングルブレイクアウトラリーは78.60%フィボナッチレベルの0.4553ドルを試すことになる。
The 52-week high currently stands at $0.48078, and the breakout rally could extend to the 1.272 Fibonacci level at $0.5113. This would establish a new 52-week high for DOGE and surpass the $0.50 psychological mark.
52週間ぶりの高値は現在0.48078ドルにあり、上昇相場は0.5113ドルの1.272フィボナッチレベルまで拡大する可能性がある。これはDOGEにとって52週間の新高値を樹立し、心理的マークの0.50ドルを超えることになる。
Conversely, a breakdown below the local support trend line could probe the 23.60% Fibonacci level at $0.39183. The rising 50 and 100 EMA lines in the 4-hour chart provide dynamic support.
逆に、ローカルサポートトレンドラインを下回る場合は、0.39183ドルの23.60%フィボナッチレベルを探る可能性があります。 4時間足チャートの上昇する50EMAラインと100EMAラインがダイナミックなサポートを提供します。
FAQs
よくある質問
What is Dogecoin's current price trend?
ドージコインの現在の価格傾向は何ですか?
Dogecoin consolidates within a triangle pattern and rallies from the support trend line. It grapples with the 50% Fibonacci level at $0.423.
ドージコインはトライアングルパターン内で統合し、サポートトレンドラインから反発します。 0.423ドルの50%フィボナッチレベルと格闘している。
What are the resistance and support levels for Dogecoin?
ドージコインのレジスタンスレベルとサポートレベルは何ですか?
Resistance exists at the 50% Fibonacci level ($0.423), with targets at $0.4553 and $0.5113. Key support is found at $0.39183 and the ascending 50 and 100 EMA lines.
抵抗線は 50% フィボナッチ レベル (0.423 ドル) にあり、ターゲットは 0.4553 ドルと 0.5113 ドルです。主なサポートは 0.39183 ドルと、上昇する 50 および 100 EMA ラインにあります。
What are the chances of Dogecoin surpassing $0.50?
ドージコインが0.50ドルを超える可能性はどのくらいでしょうか?
A breakout from the triangle pattern, supported by positive technical indicators and rising EMA lines, could propel DOGE above $0.50, potentially reaching $0.5113.
ポジティブなテクニカル指標とEMAラインの上昇に支えられ、トライアングルパターンからブレイクアウトすれば、DOGEは0.50ドルを超え、0.5113ドルに達する可能性がある。


 DogeHome
 The Bit Journal
 BlockchainReporter
 Optimisus
 CFN
CFN Coincu
 Cryptopolitan_News


