Amid the burgeoning bullish market, Dogecoin maintains its bullish trajectory and poised for a breakout. With buyers keeping the price afloat above the $0.40 mark, the likelihood of a bullish trend has escalated.
급성장하는 강세 시장 속에서 Dogecoin은 강세 궤적을 유지하고 돌파를 준비하고 있습니다. 구매자들이 가격을 0.40달러 이상으로 유지하면서 강세 추세가 나타날 가능성이 높아졌습니다.
As the broader market experiences a resurgence, DOGE could witness an upsurge beyond the $0.50 psychological threshold. Will the renowned meme coin overcome this barrier? Our latest price analysis sheds light on this question.
더 넓은 시장이 부활함에 따라 DOGE는 심리적 한계점인 0.50달러를 넘어서는 급등을 목격할 수 있습니다. 유명한 밈 코인이 이 장벽을 극복할 수 있을까요? 우리의 최신 가격 분석은 이 질문에 대해 밝혀줍니다.
Dogecoin Price Analysis
Dogecoin 가격 분석
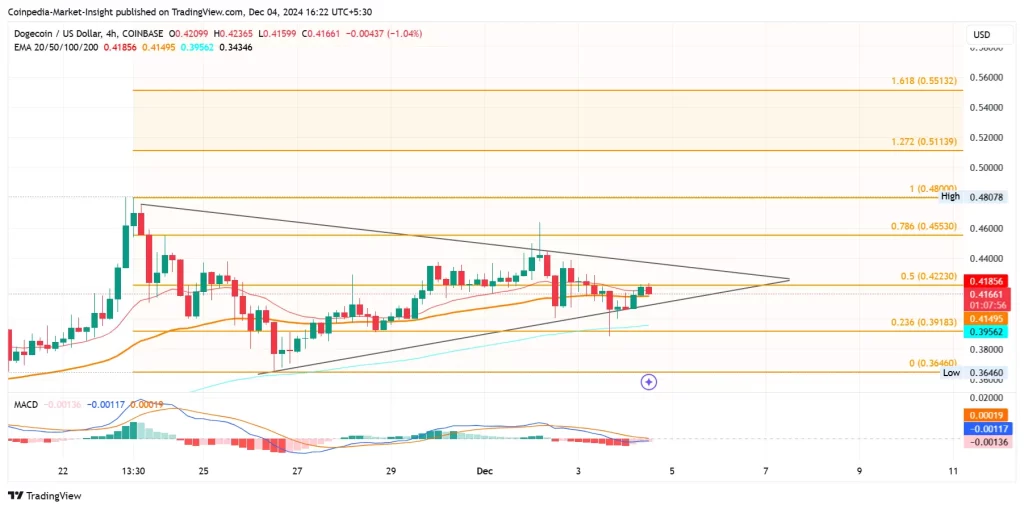
The 4-hour chart exhibits a triangle pattern formation in the DOGE price action. This consolidation between converging trend lines follows a significant surge.
4시간 차트는 DOGE 가격 움직임에서 삼각형 패턴 형성을 보여줍니다. 수렴 추세선 간의 이러한 통합은 상당한 급등을 따릅니다.
Over the past month, DOGE has yielded impressive returns, fueling the memecoin's rally. The bullish momentum has resulted in a price increase of approximately 175% during that period.
지난 한 달 동안 DOGE는 인상적인 수익을 내며 밈코인의 랠리를 촉진했습니다. 강세 모멘텀으로 인해 해당 기간 동안 가격은 약 175% 상승했습니다.

Tradingview
트레이딩뷰
Presently, DOGE demonstrates a bounce from the support trend line, forming two consecutive bullish candles. However, it faces resistance at the 50% Fibonacci level ($0.423).
현재 DOGE는 지지 추세선에서 반등하여 두 개의 연속적인 강세 양초를 형성하고 있습니다. 그러나 50% 피보나치 수준($0.423)에서 저항에 직면해 있습니다.
A 1.04% pullback in the last 4 hours reflects supply pressure and the crucial Fibonacci resistance hindering bullish growth. Nonetheless, a brief recovery rally has led to a convergence of the MACD and signal lines.
지난 4시간 동안 1.04% 하락한 것은 공급 압력과 강세 성장을 방해하는 중요한 피보나치 저항을 반영합니다. 그럼에도 불구하고, 잠시 회복세를 보이면서 MACD선과 시그널선이 수렴하는 모습을 보였습니다.
The indicator suggests a potential bullish crossover if the uptrend persists. A breakout above the 50% Fibonacci level could challenge the resistance trendline and attempt to break the triangle pattern.
이 지표는 상승 추세가 지속될 경우 잠재적인 강세 교차를 시사합니다. 50% 피보나치 수준을 돌파하면 저항 추세선에 도전하고 삼각형 패턴을 깨려고 시도할 수 있습니다.
Dogecoin Targets $0.50 Breakout
Dogecoin은 $0.50 돌파를 목표로 합니다.
Based on Fibonacci levels, the triangle breakout rally will test the 78.60% Fibonacci level at $0.4553.
피보나치 수준을 기준으로 삼각형 돌파 랠리는 $0.4553에서 78.60% 피보나치 수준을 테스트합니다.
The 52-week high currently stands at $0.48078, and the breakout rally could extend to the 1.272 Fibonacci level at $0.5113. This would establish a new 52-week high for DOGE and surpass the $0.50 psychological mark.
현재 52주 최고가는 $0.48078이며 돌파 랠리는 $0.5113의 1.272 피보나치 레벨까지 확장될 수 있습니다. 이는 DOGE의 새로운 52주 최고치를 수립하고 심리적인 $0.50를 넘어설 것입니다.
Conversely, a breakdown below the local support trend line could probe the 23.60% Fibonacci level at $0.39183. The rising 50 and 100 EMA lines in the 4-hour chart provide dynamic support.
반대로, 현지 지지 추세선 아래로 하락하면 $0.39183에서 23.60% 피보나치 수준을 조사할 수 있습니다. 4시간 차트에서 상승하는 50 및 100 EMA 라인은 역동적인 지지를 제공합니다.
FAQs
자주 묻는 질문
What is Dogecoin's current price trend?
Dogecoin의 현재 가격 추세는 어떻습니까?
Dogecoin consolidates within a triangle pattern and rallies from the support trend line. It grapples with the 50% Fibonacci level at $0.423.
Dogecoin은 삼각형 패턴 내에서 통합되고 지지 추세선에서 반등합니다. $0.423에서 50% 피보나치 수준을 유지하고 있습니다.
What are the resistance and support levels for Dogecoin?
Dogecoin의 저항 및 지원 수준은 무엇입니까?
Resistance exists at the 50% Fibonacci level ($0.423), with targets at $0.4553 and $0.5113. Key support is found at $0.39183 and the ascending 50 and 100 EMA lines.
저항은 50% 피보나치 수준($0.423)에 존재하며 목표는 $0.4553 및 $0.5113입니다. 주요 지원은 $0.39183과 오름차순 50 및 100 EMA 라인에서 찾을 수 있습니다.
What are the chances of Dogecoin surpassing $0.50?
Dogecoin이 $0.50를 넘어설 가능성은 얼마나 됩니까?
A breakout from the triangle pattern, supported by positive technical indicators and rising EMA lines, could propel DOGE above $0.50, potentially reaching $0.5113.
긍정적인 기술 지표와 상승하는 EMA 라인에 의해 뒷받침되는 삼각형 패턴의 돌파는 DOGE를 $0.50 이상으로 끌어올려 잠재적으로 $0.5113에 도달할 수 있습니다.


 DogeHome
 The Bit Journal
 BlockchainReporter
 Optimisus
 CFN
CFN Coincu
 Cryptopolitan_News


