Pepe Price Decline Raises Concerns
The uncertain crypto market situation has impacted the price of PEPE, causing frustrations for investors. Technically, traders should be aware of the potential retracement to $0.00000586.
PEPE Price Retraces
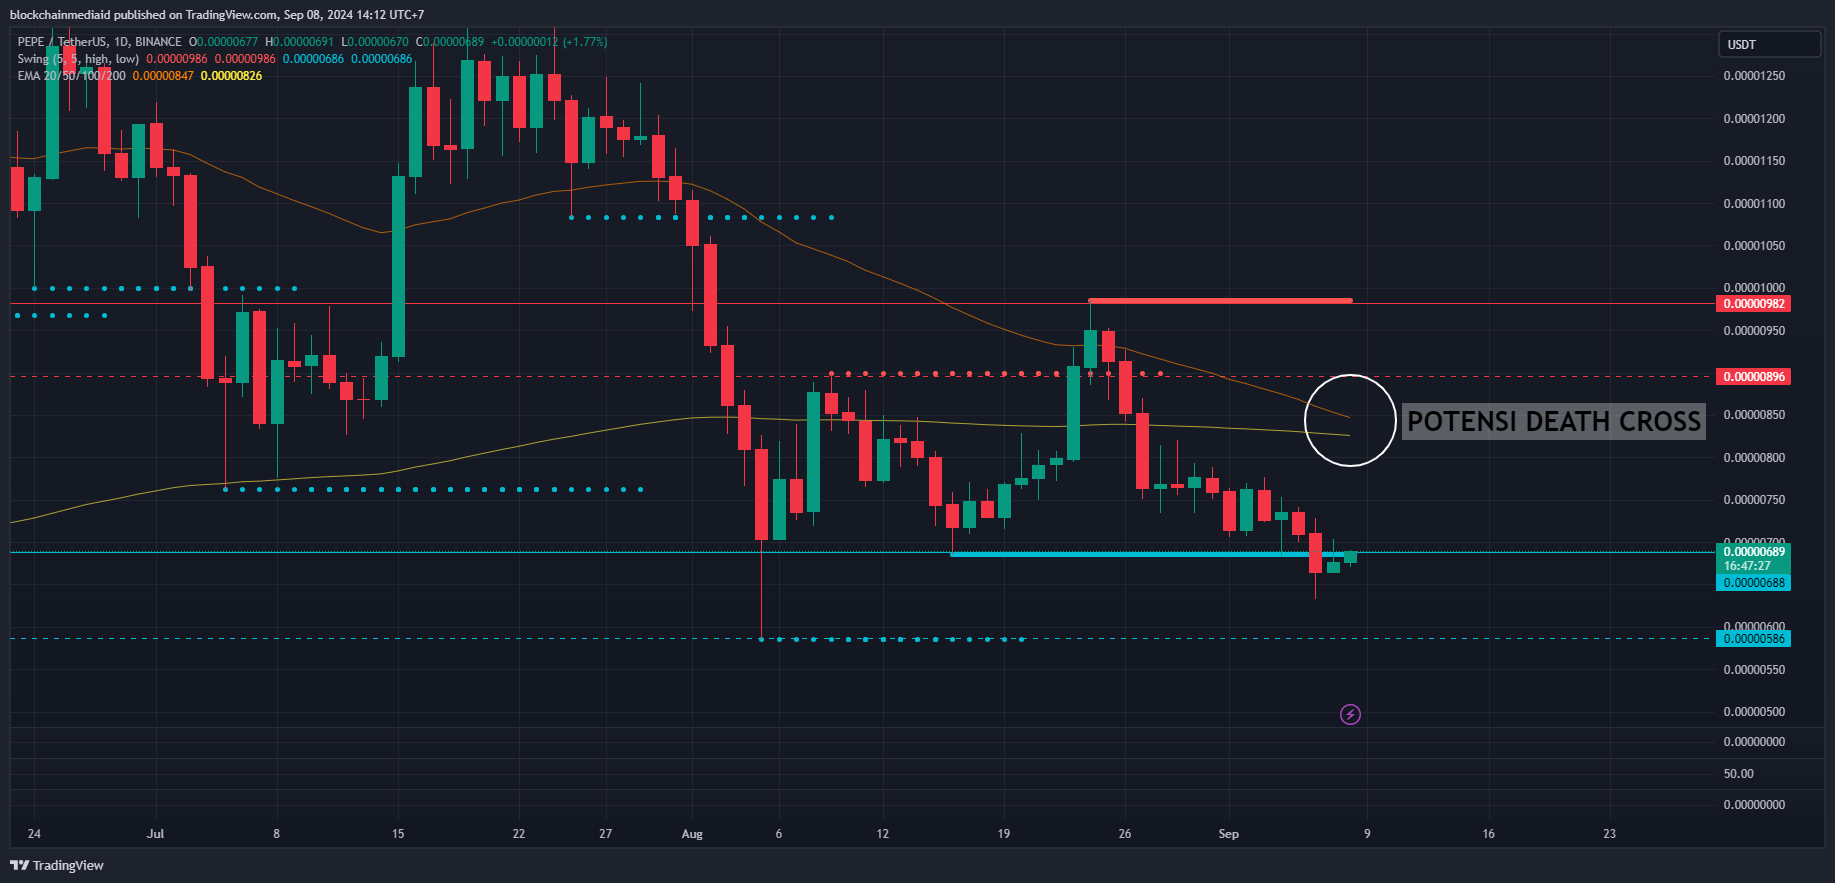
Within the last 30 days, PEPE's price has depreciated by 21.36% to $0.00000684, below its key support level established in late August 2024.
Based on the Swing High Low Support & Resistance indicator, PEPE has been testing the support level of $0.00000688 on the daily chart since September 6, 2024. If the price fails to recover above this level, it could potentially retest the lower support at $0.00000586, reached on August 5, 2024.
Resistance levels to watch above include $0.00000896 and $0.00000982, achieved on August 26 and 24, 2024, respectively.

Potential Death Cross Ahead
Adding to the selling pressure on PEPE is the trendline of the 50-day Exponential Moving Average (EMA) and 200-day EMA. On the daily time frame, a potential death cross formation could occur in the coming days.
This pattern is formed when a short-term moving average (通常为50日移动平均线) crosses below a long-term moving average (通常为200日移动平均线). It is considered a strong bearish signal and indicates that the price momentum is weakening, suggesting further declines.
No Bullish Momentum Yet
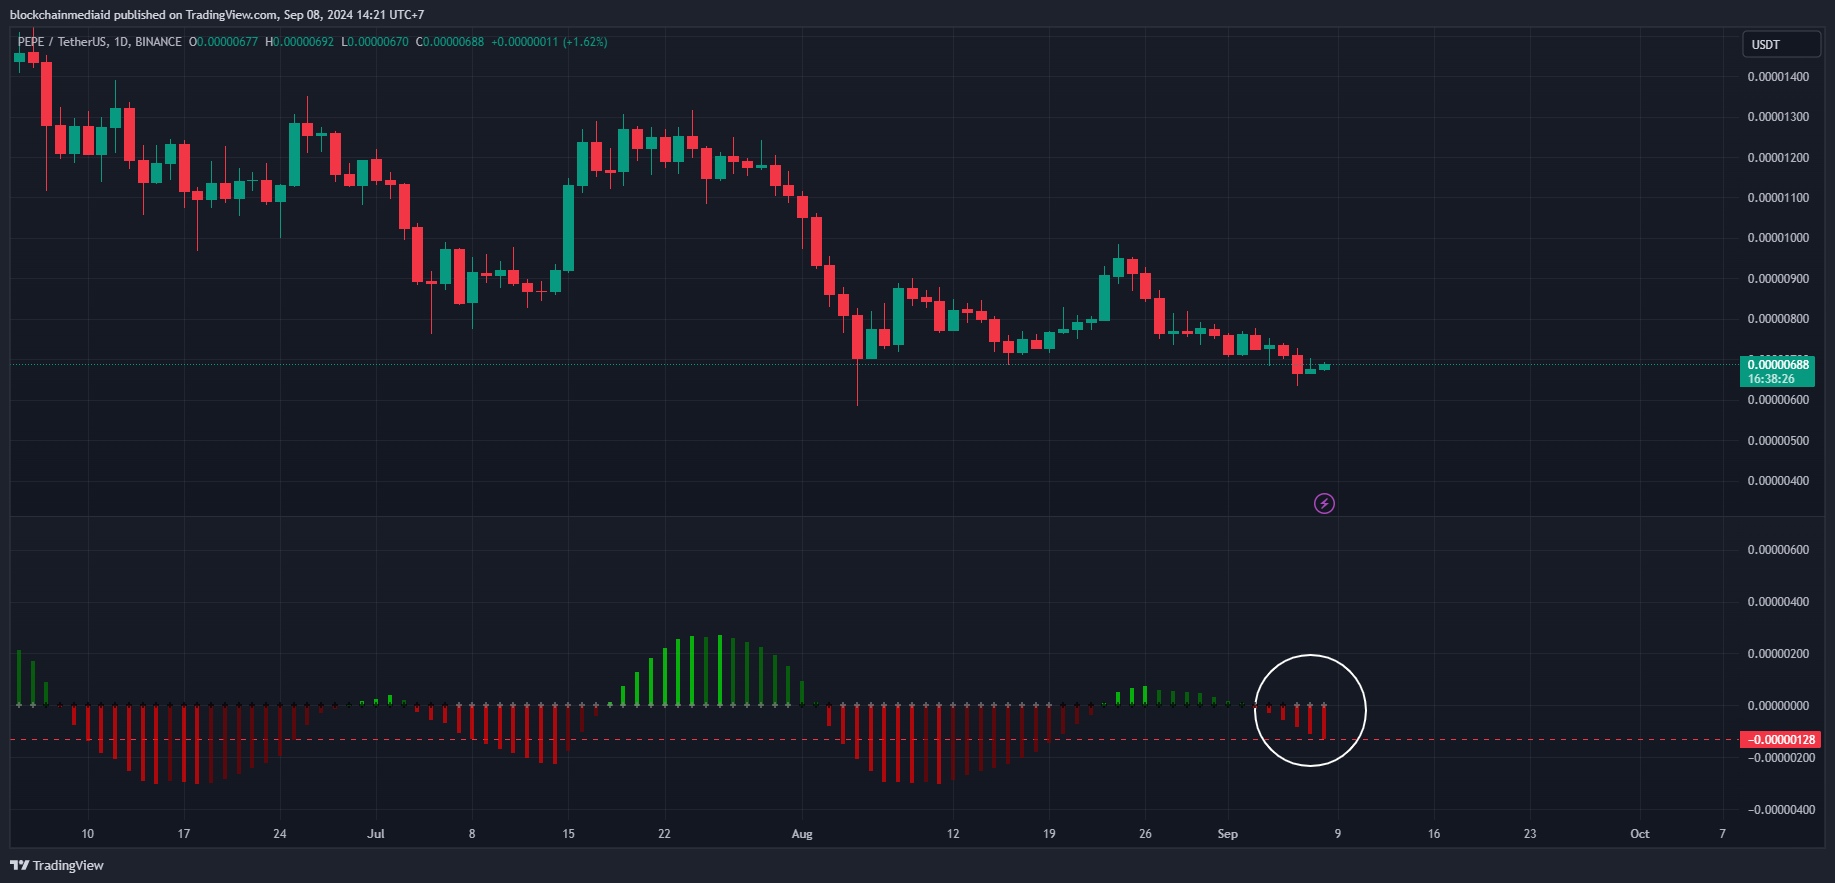
The Squeeze Momentum indicator, which measures the strength of PEPE's price movement, shows no sign of a reversal. Its current momentum value is at -0.000001280.

This adds to the negative momentum from the weekly time frame (see above), which has been in place since August 12, 2024. PEPE's momentum weakness intensified on June 10, 2024, after peaking the week before on June 3, 2024. This suggests that further declines are possible in the medium term.
Additional Analysis on 4-Hour and Daily Time Frames
On the shorter 4-hour time frame, PEPE attempted to rally but remains in a downtrend after breaking below $0.00000766. It is currently trading below the 100-day Simple Moving Average (SMA). The current price is approaching the support level of $0.00000589, amidst continued negative market sentiment.
The Relative Strength Index (RSI) indicator on the 4-hour chart shows a reading of 31%, indicating that PEPE is oversold. This suggests that the selling pressure could ease, allowing for a short-term bounce or consolidation if the bears do not remain dominant.
On the daily time frame, the bearish momentum is strong. After breaking below $0.00000766 and trading beneath the 100-day SMA, PEPE has faced significant selling. While there has been an attempt to recover, the rally is likely temporary as bearish sentiment prevails and weighs down on the price.
The RSI on the daily chart is below 50% at 36%, confirming that PEPE remains under bearish pressure. This suggests that the bears are likely to regain control and push the price lower.


 TheNewsCrypto
 Times Tabloid
 DogeHome
 CFN
CFN Crypto Daily™
 DogeHome
 Crypto Daily™
 TheCoinrise Media
 Crypto Daily™


