Pepe Price Decline Raises Concerns
ペペ価格下落で懸念が高まる
The uncertain crypto market situation has impacted the price of PEPE, causing frustrations for investors. Technically, traders should be aware of the potential retracement to $0.00000586.
不確実な仮想通貨市場の状況はPEPEの価格に影響を与え、投資家に不満を引き起こしています。技術的には、トレーダーは0.00000586ドルまでのリトレースメントの可能性を認識しておく必要があります。
PEPE Price Retraces
PEPE価格のリトレース
Within the last 30 days, PEPE's price has depreciated by 21.36% to $0.00000684, below its key support level established in late August 2024.
過去30日間で、PEPEの価格は21.36%下落して0.00000684ドルとなり、2024年8月下旬に設定された主要なサポートレベルを下回りました。
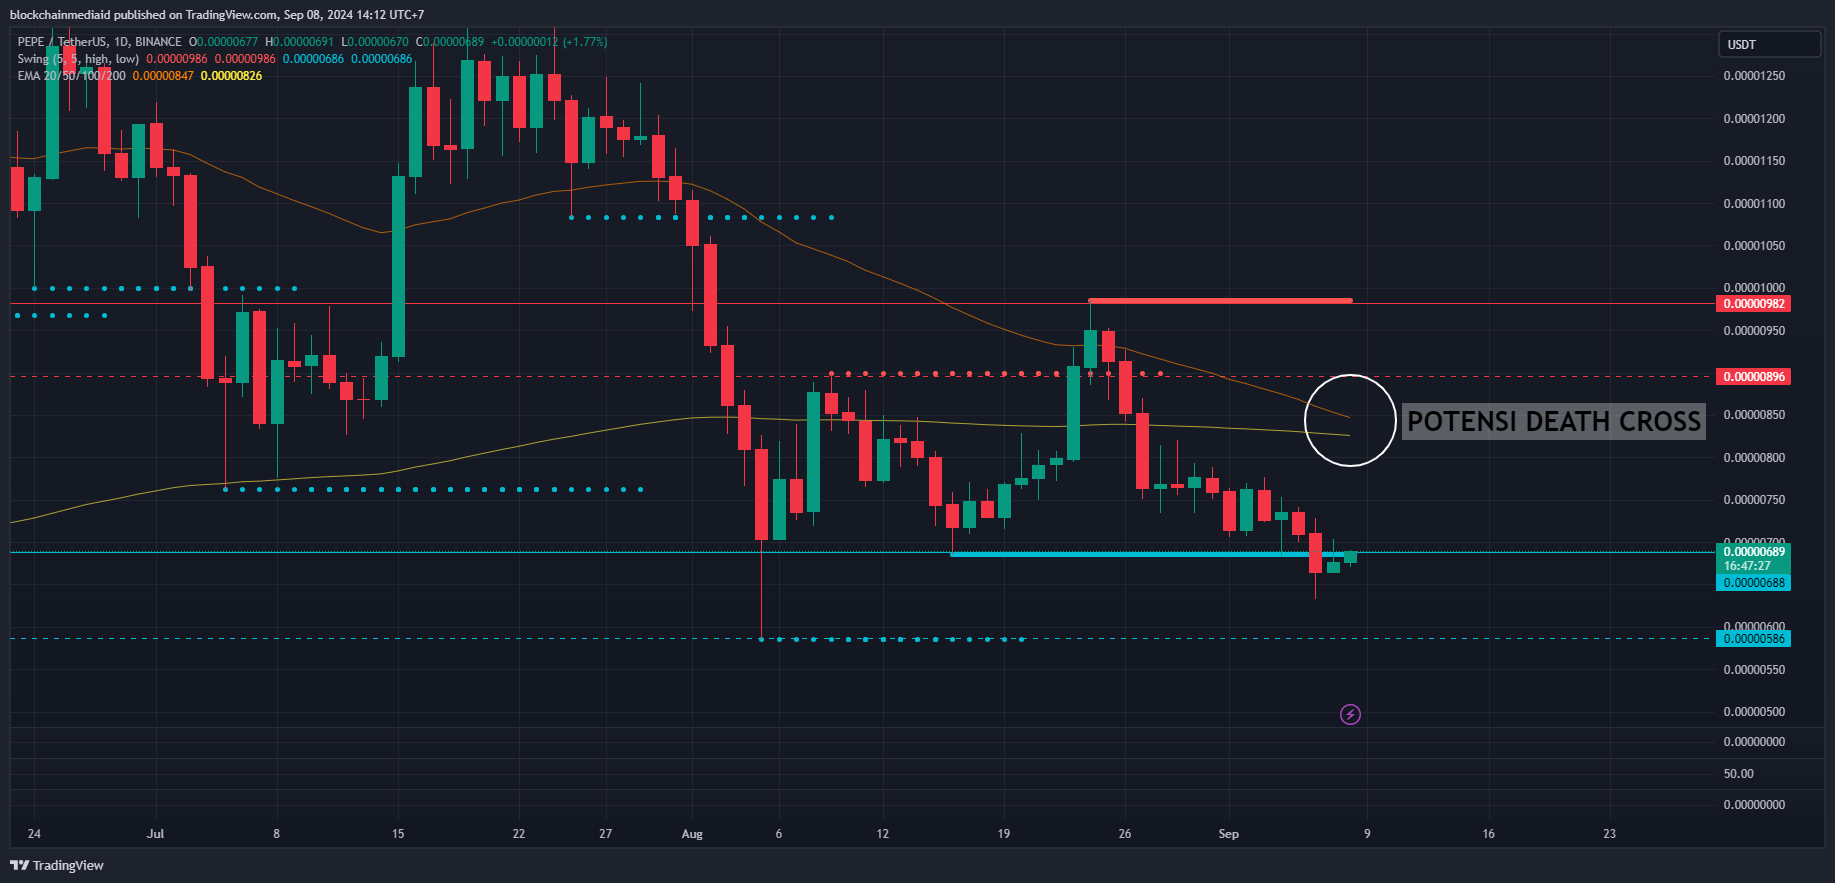
Based on the Swing High Low Support & Resistance indicator, PEPE has been testing the support level of $0.00000688 on the daily chart since September 6, 2024. If the price fails to recover above this level, it could potentially retest the lower support at $0.00000586, reached on August 5, 2024.
スイング高低サポート&レジスタンス指標に基づいて、PEPEは2024年9月6日以来、日足チャートで0.00000688ドルのサポートレベルをテストしてきました。価格がこのレベルを超えて回復できなかった場合、0.00000586ドルの下位サポートを再テストする可能性があります。 2024 年 8 月 5 日に到達しました。
Resistance levels to watch above include $0.00000896 and $0.00000982, achieved on August 26 and 24, 2024, respectively.
上記で注目すべき抵抗レベルには、それぞれ 2024 年 8 月 26 日と 24 日に達成された 0.00000896 ドルと 0.00000982 ドルが含まれます。

Potential Death Cross Ahead
死の可能性が待ち受けている
Adding to the selling pressure on PEPE is the trendline of the 50-day Exponential Moving Average (EMA) and 200-day EMA. On the daily time frame, a potential death cross formation could occur in the coming days.
PEPEに対する売り圧力をさらに強めているのは、50日指数移動平均(EMA)と200日EMAのトレンドラインです。毎日の時間枠で見ると、数日以内に潜在的なデスクロス形成が発生する可能性があります。
This pattern is formed when a short-term moving average (通常为50日移动平均线) crosses below a long-term moving average (通常为200日移动平均线). It is considered a strong bearish signal and indicates that the price momentum is weakening, suggesting further declines.
このパターンは、短期移動平均 (通常は 50 日移動平均) が長期移動平均 (通常は 200 日移動平均) を下回るときに形成され、強い弱気シグナルとみなされ、価格が下落していることを示します。勢いは弱まっており、さらなる下落を示唆している。
No Bullish Momentum Yet
まだ強気の勢いはない
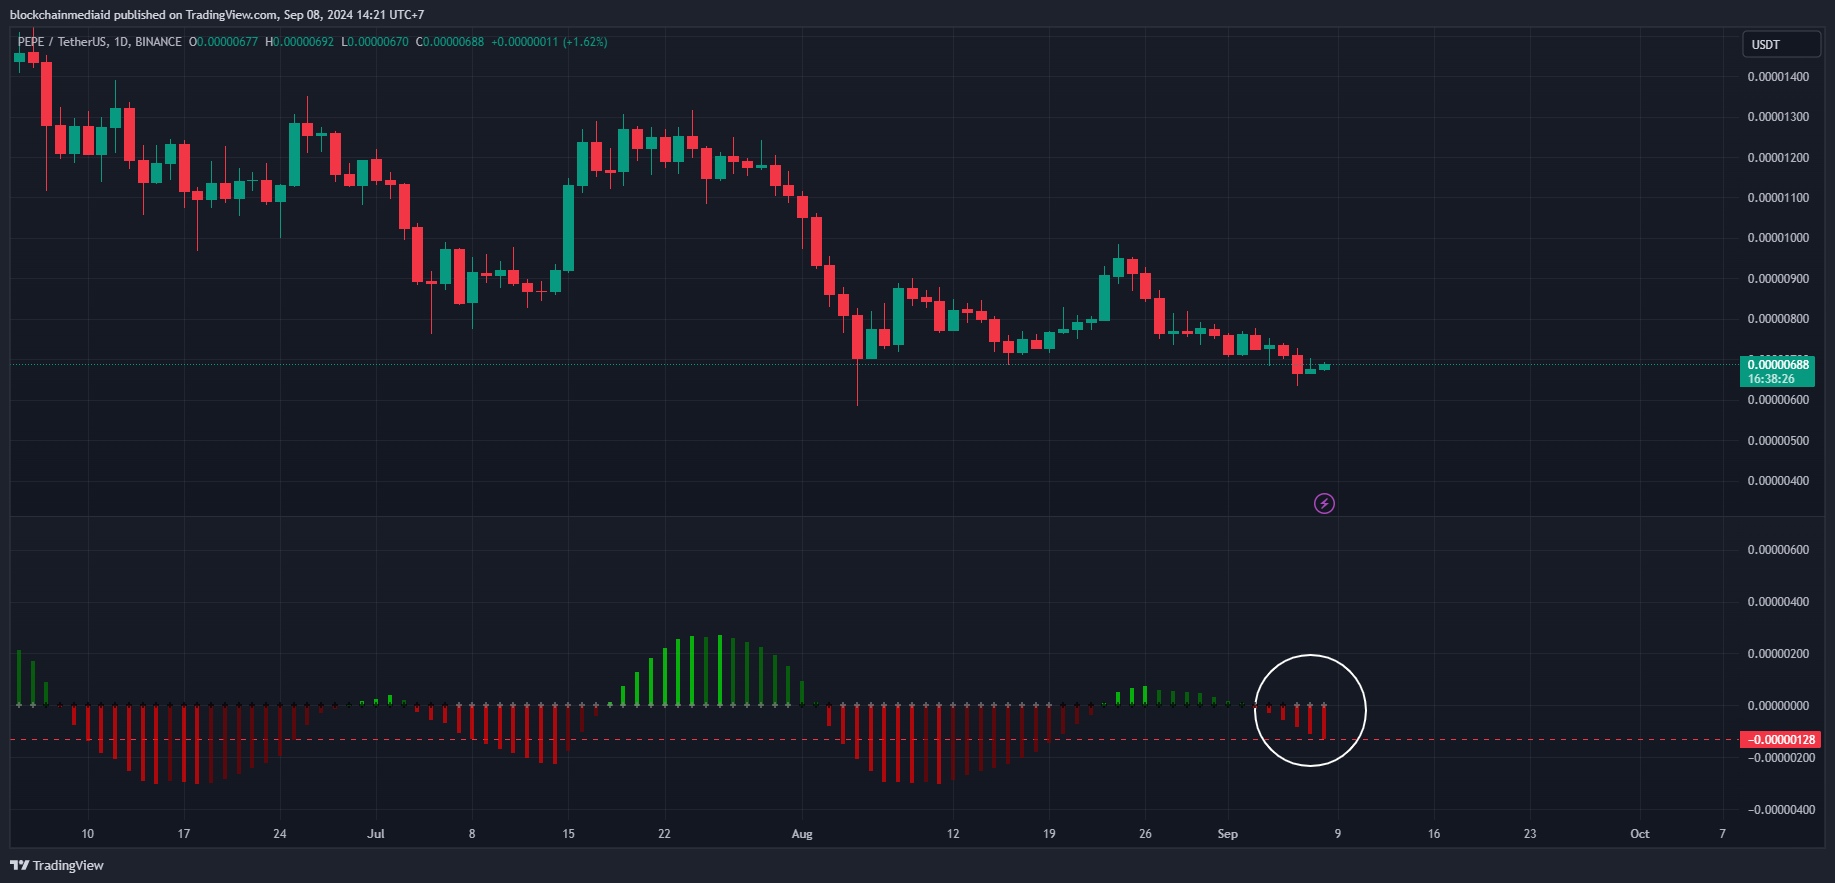
The Squeeze Momentum indicator, which measures the strength of PEPE's price movement, shows no sign of a reversal. Its current momentum value is at -0.000001280.
PEPEの価格変動の強さを測定するスクイーズモメンタム指標は反転の兆候を示していません。現在の運動量の値は -0.000001280 です。

This adds to the negative momentum from the weekly time frame (see above), which has been in place since August 12, 2024. PEPE's momentum weakness intensified on June 10, 2024, after peaking the week before on June 3, 2024. This suggests that further declines are possible in the medium term.
これは、2024年8月12日以来続いている週足の時間枠(上記参照)からのマイナスの勢いをさらに強めます。PEPEの勢いの弱さは、前週の2024年6月3日にピークに達した後、2024年6月10日に激化しました。これは示唆しています。中期的にはさらなる下落の可能性がある。
Additional Analysis on 4-Hour and Daily Time Frames
4時間足と日足の時間枠での追加分析
On the shorter 4-hour time frame, PEPE attempted to rally but remains in a downtrend after breaking below $0.00000766. It is currently trading below the 100-day Simple Moving Average (SMA). The current price is approaching the support level of $0.00000589, amidst continued negative market sentiment.
4時間という短い時間枠では、PEPEは上昇を試みましたが、0.00000766ドルを下回った後は依然として下降傾向にあります。現在は100日単純移動平均(SMA)を下回って取引されている。否定的な市場センチメントが続く中、現在の価格はサポートレベルの0.00000589ドルに近づいています。
The Relative Strength Index (RSI) indicator on the 4-hour chart shows a reading of 31%, indicating that PEPE is oversold. This suggests that the selling pressure could ease, allowing for a short-term bounce or consolidation if the bears do not remain dominant.
4時間足チャートの相対力指数(RSI)指標は31%を示し、PEPEが売られすぎていることを示しています。これは、弱気派が優勢を維持しない場合、売り圧力が緩和され、短期的な反発または値固めが可能になる可能性があることを示唆している。
On the daily time frame, the bearish momentum is strong. After breaking below $0.00000766 and trading beneath the 100-day SMA, PEPE has faced significant selling. While there has been an attempt to recover, the rally is likely temporary as bearish sentiment prevails and weighs down on the price.
日足の時間枠では、弱気の勢いが強いです。 0.00000766ドルを割り、100日SMAを下回って取引された後、PEPEは大幅な売りに直面しました。回復の試みはあるものの、弱気なセンチメントが優勢で価格を圧迫しているため、上昇は一時的なものとなる可能性が高い。
The RSI on the daily chart is below 50% at 36%, confirming that PEPE remains under bearish pressure. This suggests that the bears are likely to regain control and push the price lower.
日足チャートのRSIは36%と50%を下回っており、PEPEが引き続き弱気圧力にさらされていることを確認している。これは、弱気派が主導権を取り戻し、価格を押し下げる可能性が高いことを示唆している。


 Thecoinrepublic.com
 Cryptopolitan_News
 CryptoNewsLand
 DogeHome
 CryptoNewsLand
 crypto.ro English
 CoinoMedia


