Pepe Price Decline Raises Concerns
Pepe 가격 하락으로 우려가 제기됨
The uncertain crypto market situation has impacted the price of PEPE, causing frustrations for investors. Technically, traders should be aware of the potential retracement to $0.00000586.
불확실한 암호화폐 시장 상황은 PEPE 가격에 영향을 미쳐 투자자들에게 좌절감을 안겨주었습니다. 기술적으로 트레이더들은 $0.00000586까지의 되돌림 가능성을 인지하고 있어야 합니다.
PEPE Price Retraces
PEPE 가격 되돌림
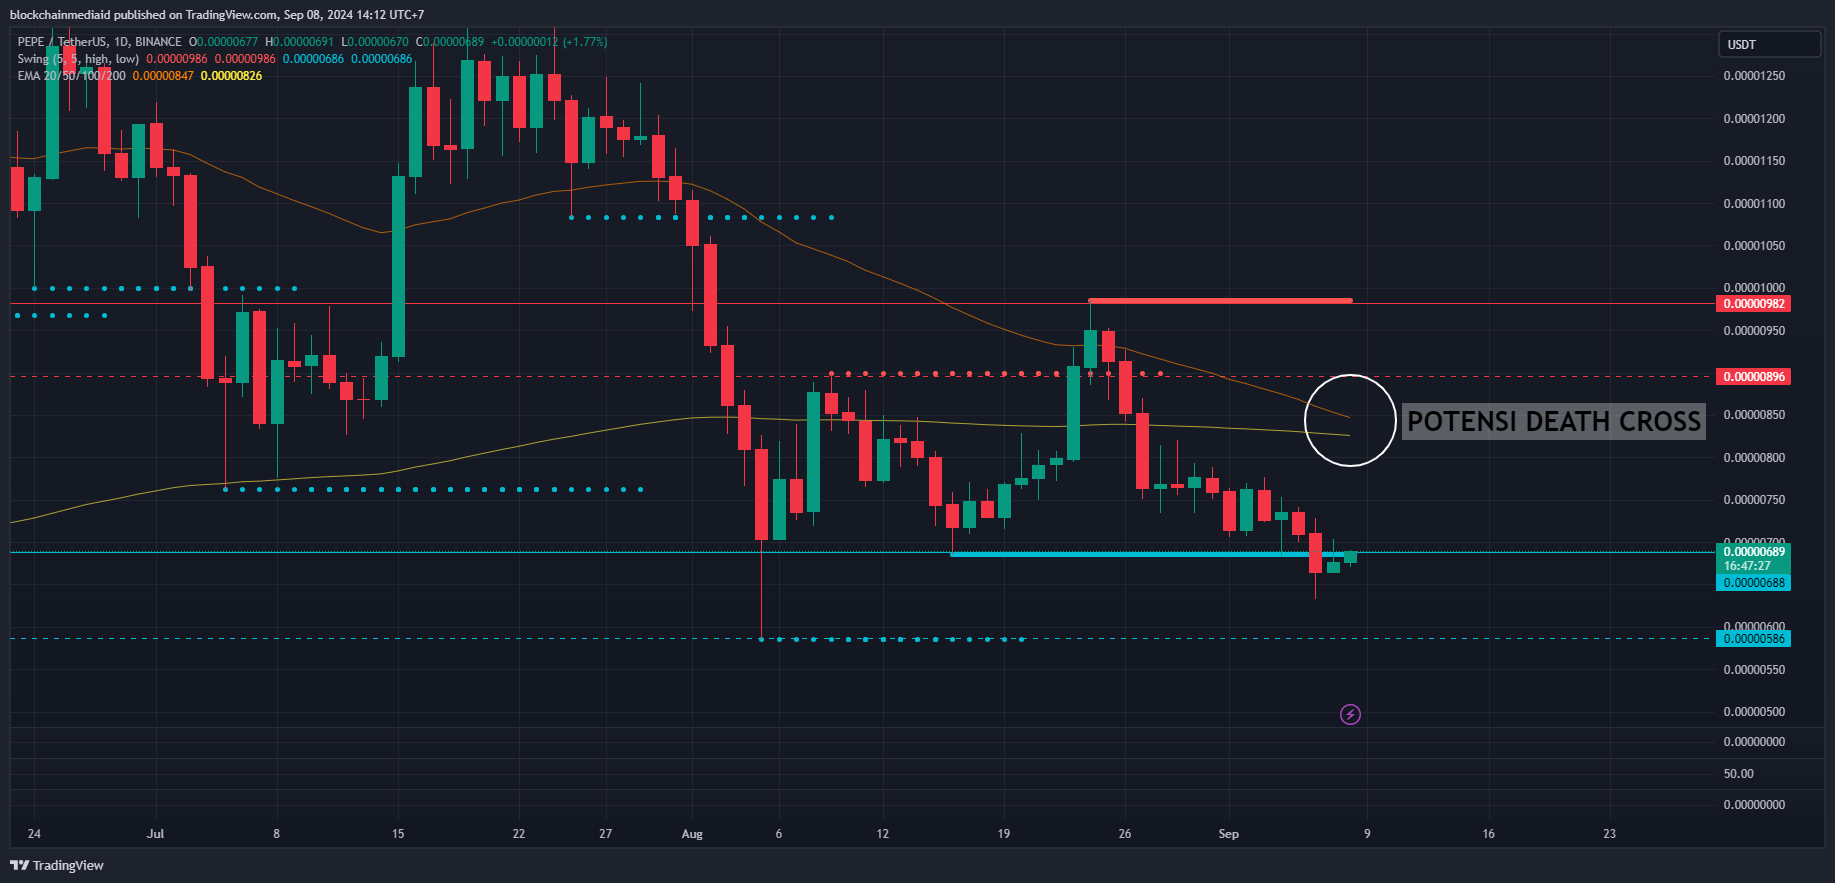
Within the last 30 days, PEPE's price has depreciated by 21.36% to $0.00000684, below its key support level established in late August 2024.
지난 30일 동안 PEPE 가격은 21.36% 하락한 $0.00000684로 2024년 8월 말에 설정된 주요 지원 수준보다 낮았습니다.
Based on the Swing High Low Support & Resistance indicator, PEPE has been testing the support level of $0.00000688 on the daily chart since September 6, 2024. If the price fails to recover above this level, it could potentially retest the lower support at $0.00000586, reached on August 5, 2024.
Swing High Low 지원 및 저항 지표를 기반으로 PEPE는 2024년 9월 6일부터 일일 차트에서 $0.00000688의 지원 수준을 테스트해 왔습니다. 가격이 이 수준 이상으로 회복되지 않으면 잠재적으로 $0.00000586에서 낮은 지원을 다시 테스트할 수 있습니다. 2024년 8월 5일에 도달했습니다.
Resistance levels to watch above include $0.00000896 and $0.00000982, achieved on August 26 and 24, 2024, respectively.
위에서 주목해야 할 저항 수준에는 각각 2024년 8월 26일과 24일에 달성된 $0.00000896 및 $0.00000982가 포함됩니다.

Potential Death Cross Ahead
잠재적인 죽음의 교차점
Adding to the selling pressure on PEPE is the trendline of the 50-day Exponential Moving Average (EMA) and 200-day EMA. On the daily time frame, a potential death cross formation could occur in the coming days.
PEPE에 대한 매도 압력을 더하는 것은 50일 지수 이동 평균(EMA)과 200일 EMA의 추세선입니다. 일일 시간대에서 향후 며칠 내에 잠재적인 데드 크로스 형성이 발생할 수 있습니다.
This pattern is formed when a short-term moving average (通常为50日移动平均线) crosses below a long-term moving average (通常为200日移动平均线). It is considered a strong bearish signal and indicates that the price momentum is weakening, suggesting further declines.
이 패턴은 단기 이동 평균(보통 50일 이동 평균)이 장기 이동 평균(보통 200일 이동 평균)을 하향 교차할 때 형성됩니다. 이는 강한 약세 신호로 간주되며 가격이 하락했음을 나타냅니다. 모멘텀이 약해지고 있어 추가 하락세를 시사하고 있습니다.
No Bullish Momentum Yet
아직 강세 모멘텀은 없음
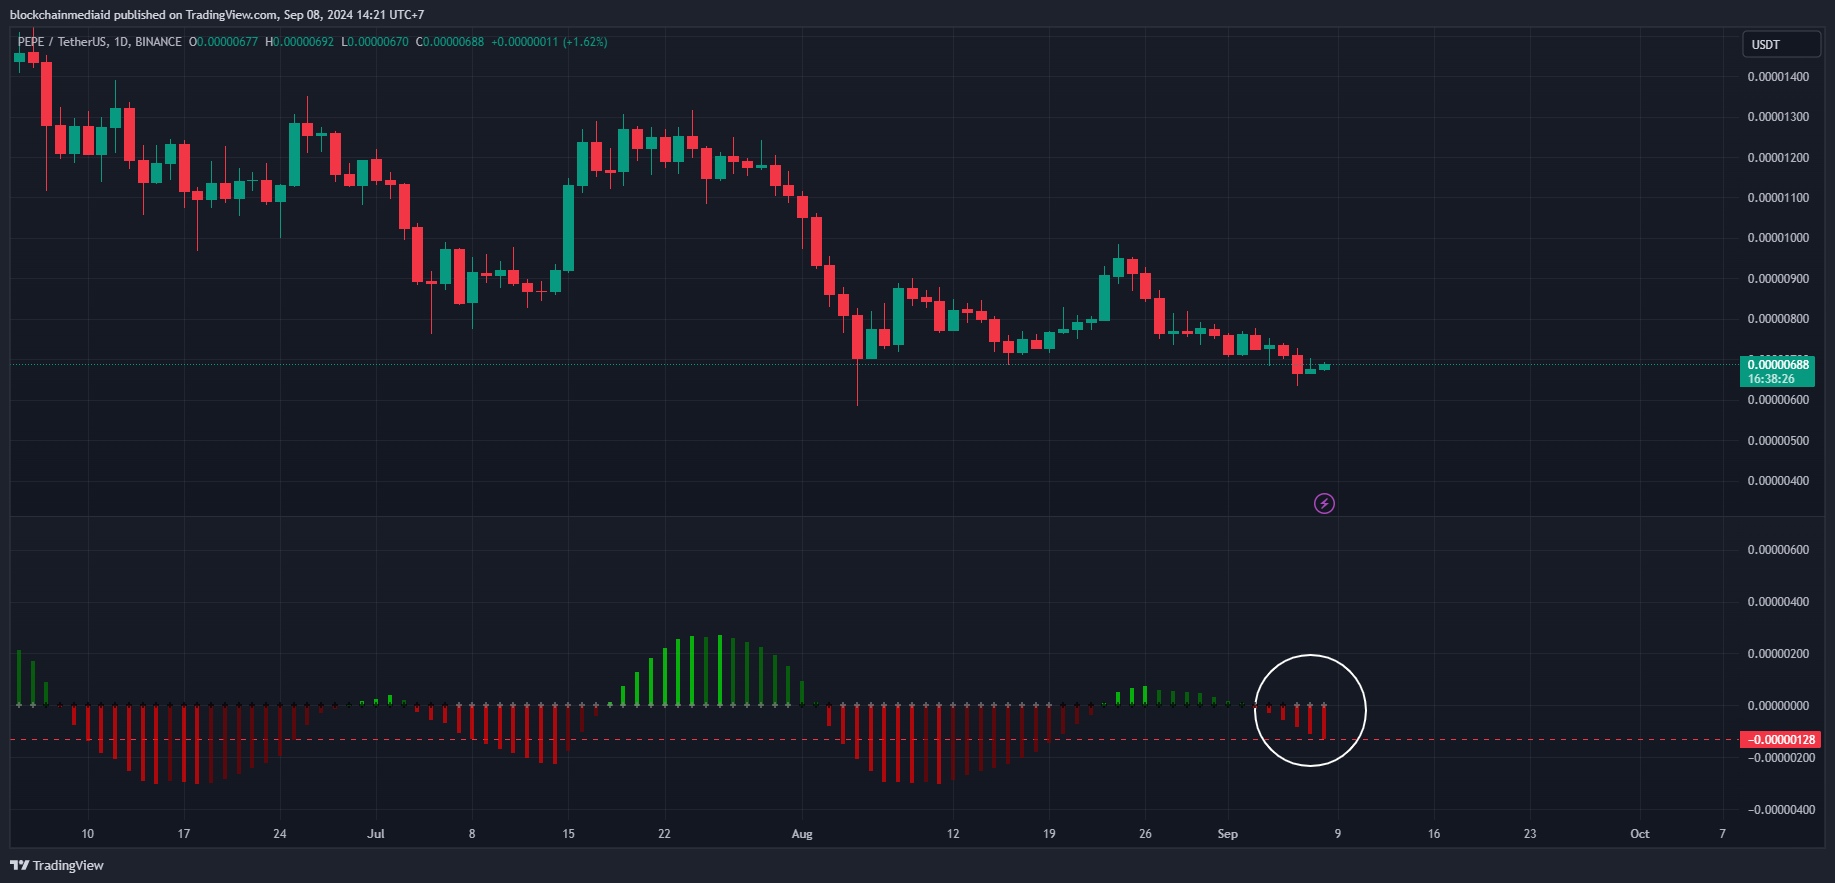
The Squeeze Momentum indicator, which measures the strength of PEPE's price movement, shows no sign of a reversal. Its current momentum value is at -0.000001280.
PEPE의 가격 움직임의 강도를 측정하는 Squeeze Momentum 지표는 반전의 조짐을 보이지 않습니다. 현재 모멘텀 값은 -0.000001280입니다.

This adds to the negative momentum from the weekly time frame (see above), which has been in place since August 12, 2024. PEPE's momentum weakness intensified on June 10, 2024, after peaking the week before on June 3, 2024. This suggests that further declines are possible in the medium term.
이는 2024년 8월 12일부터 진행된 주간 시간대(위 참조)의 부정적인 모멘텀에 추가됩니다. PEPE의 모멘텀 약세는 2024년 6월 3일 전주 정점을 찍은 후 2024년 6월 10일에 강화되었습니다. 중기적으로 추가 하락이 가능하다는 것이다.
Additional Analysis on 4-Hour and Daily Time Frames
4시간 및 일일 시간대에 대한 추가 분석
On the shorter 4-hour time frame, PEPE attempted to rally but remains in a downtrend after breaking below $0.00000766. It is currently trading below the 100-day Simple Moving Average (SMA). The current price is approaching the support level of $0.00000589, amidst continued negative market sentiment.
더 짧은 4시간 프레임에서 PEPE는 반등을 시도했지만 $0.00000766 아래로 하락한 후 하락세를 유지하고 있습니다. 현재 100일 단순이동평균(SMA) 밑에서 거래되고 있습니다. 부정적인 시장 심리가 지속되는 가운데 현재 가격은 지지 수준인 $0.00000589에 근접하고 있습니다.
The Relative Strength Index (RSI) indicator on the 4-hour chart shows a reading of 31%, indicating that PEPE is oversold. This suggests that the selling pressure could ease, allowing for a short-term bounce or consolidation if the bears do not remain dominant.
4시간 차트의 상대강도지수(RSI) 지표는 31%로 PEPE가 과매도되었음을 나타냅니다. 이는 매도 압력이 완화되어 약세가 지배력을 유지하지 못할 경우 단기 반등 또는 통합이 허용될 수 있음을 의미합니다.
On the daily time frame, the bearish momentum is strong. After breaking below $0.00000766 and trading beneath the 100-day SMA, PEPE has faced significant selling. While there has been an attempt to recover, the rally is likely temporary as bearish sentiment prevails and weighs down on the price.
일일 시간대에서는 약세 모멘텀이 강합니다. $0.00000766 아래로 하락하고 100일 SMA 아래에서 거래된 후 PEPE는 상당한 매도에 직면했습니다. 회복하려는 시도가 있었지만 약세 정서가 만연하고 가격을 압박하고 있기 때문에 랠리는 일시적일 가능성이 높습니다.
The RSI on the daily chart is below 50% at 36%, confirming that PEPE remains under bearish pressure. This suggests that the bears are likely to regain control and push the price lower.
일일 차트의 RSI는 36%로 50% 미만으로 PEPE가 여전히 약세 압력을 받고 있음을 확인시켜 줍니다. 이는 하락세가 통제권을 되찾고 가격을 더 낮출 가능성이 있음을 시사합니다.


 Crypto Daily™
 DogeHome
 ETHNews
 Crypto Daily™
 crypto.ro English
 Thecoinrepublic.com
 Crypto Daily™
 U.Today


