Pepe Price Decline Raises Concerns
佩佩价格下跌引发担忧
The uncertain crypto market situation has impacted the price of PEPE, causing frustrations for investors. Technically, traders should be aware of the potential retracement to $0.00000586.
加密货币市场形势的不确定性影响了 PEPE 的价格,令投资者感到沮丧。从技术上讲,交易者应该意识到可能回撤至 0.00000586 美元。
PEPE Price Retraces
PEPE 价格回调
Within the last 30 days, PEPE's price has depreciated by 21.36% to $0.00000684, below its key support level established in late August 2024.
在过去 30 天内,PEPE 的价格下跌了 21.36%,至 0.00000684 美元,低于 2024 年 8 月下旬建立的关键支撑位。
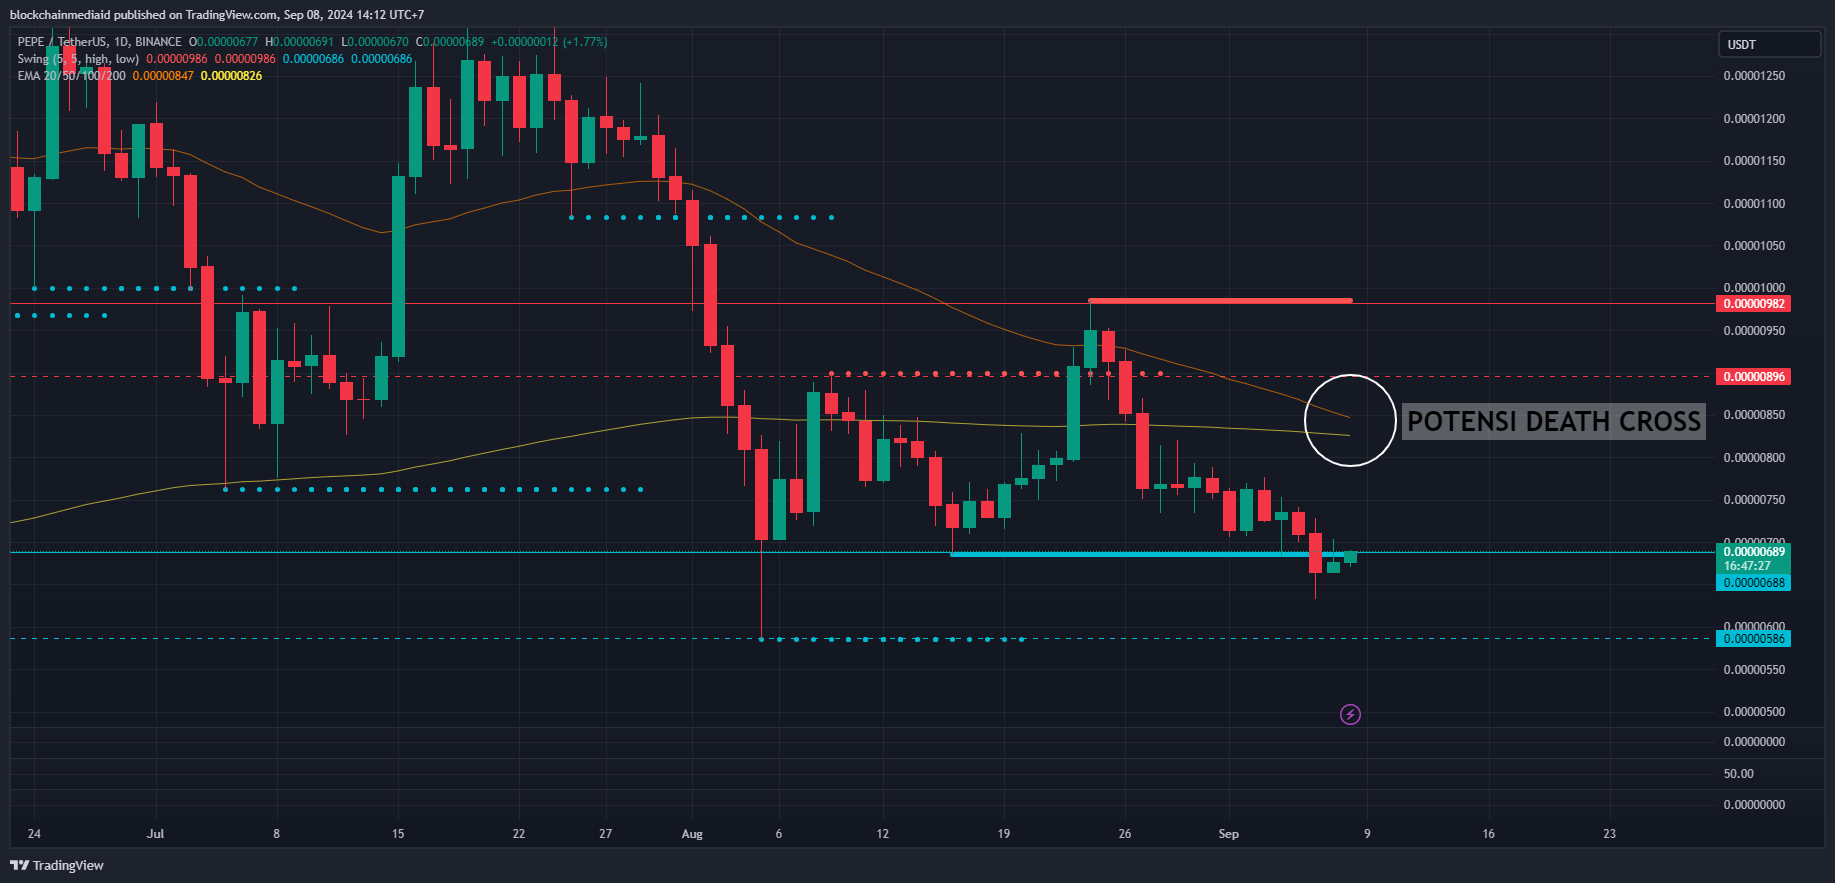
Based on the Swing High Low Support & Resistance indicator, PEPE has been testing the support level of $0.00000688 on the daily chart since September 6, 2024. If the price fails to recover above this level, it could potentially retest the lower support at $0.00000586, reached on August 5, 2024.
根据波动高低支撑和阻力指标,自 2024 年 9 月 6 日以来,PEPE 一直在日线图上测试 0.00000688 美元的支撑位。如果价格未能恢复至该水平之上,则可能会重新测试 0.00000586 美元的较低支撑位,于 2024 年 8 月 5 日达到。
Resistance levels to watch above include $0.00000896 and $0.00000982, achieved on August 26 and 24, 2024, respectively.
上方值得关注的阻力位包括分别于 2024 年 8 月 26 日和 24 日达到的 0.00000896 美元和 0.00000982 美元。

Potential Death Cross Ahead
前方潜在的死亡交叉
Adding to the selling pressure on PEPE is the trendline of the 50-day Exponential Moving Average (EMA) and 200-day EMA. On the daily time frame, a potential death cross formation could occur in the coming days.
50 日指数移动平均线 (EMA) 和 200 日 EMA 的趋势线增加了 PEPE 的抛售压力。从每日时间范围来看,未来几天可能会出现潜在的死亡交叉形成。
This pattern is formed when a short-term moving average (通常为50日移动平均线) crosses below a long-term moving average (通常为200日移动平均线). It is considered a strong bearish signal and indicates that the price momentum is weakening, suggesting further declines.
This pattern is formed when a short-term moving average (通常为50日移动平均线) crosses below a long-term moving average (通常为200日移动平均线). It is considered a strong bearish signal and indicates that the price momentum is weakening, suggesting further declines.
No Bullish Momentum Yet
尚无看涨势头
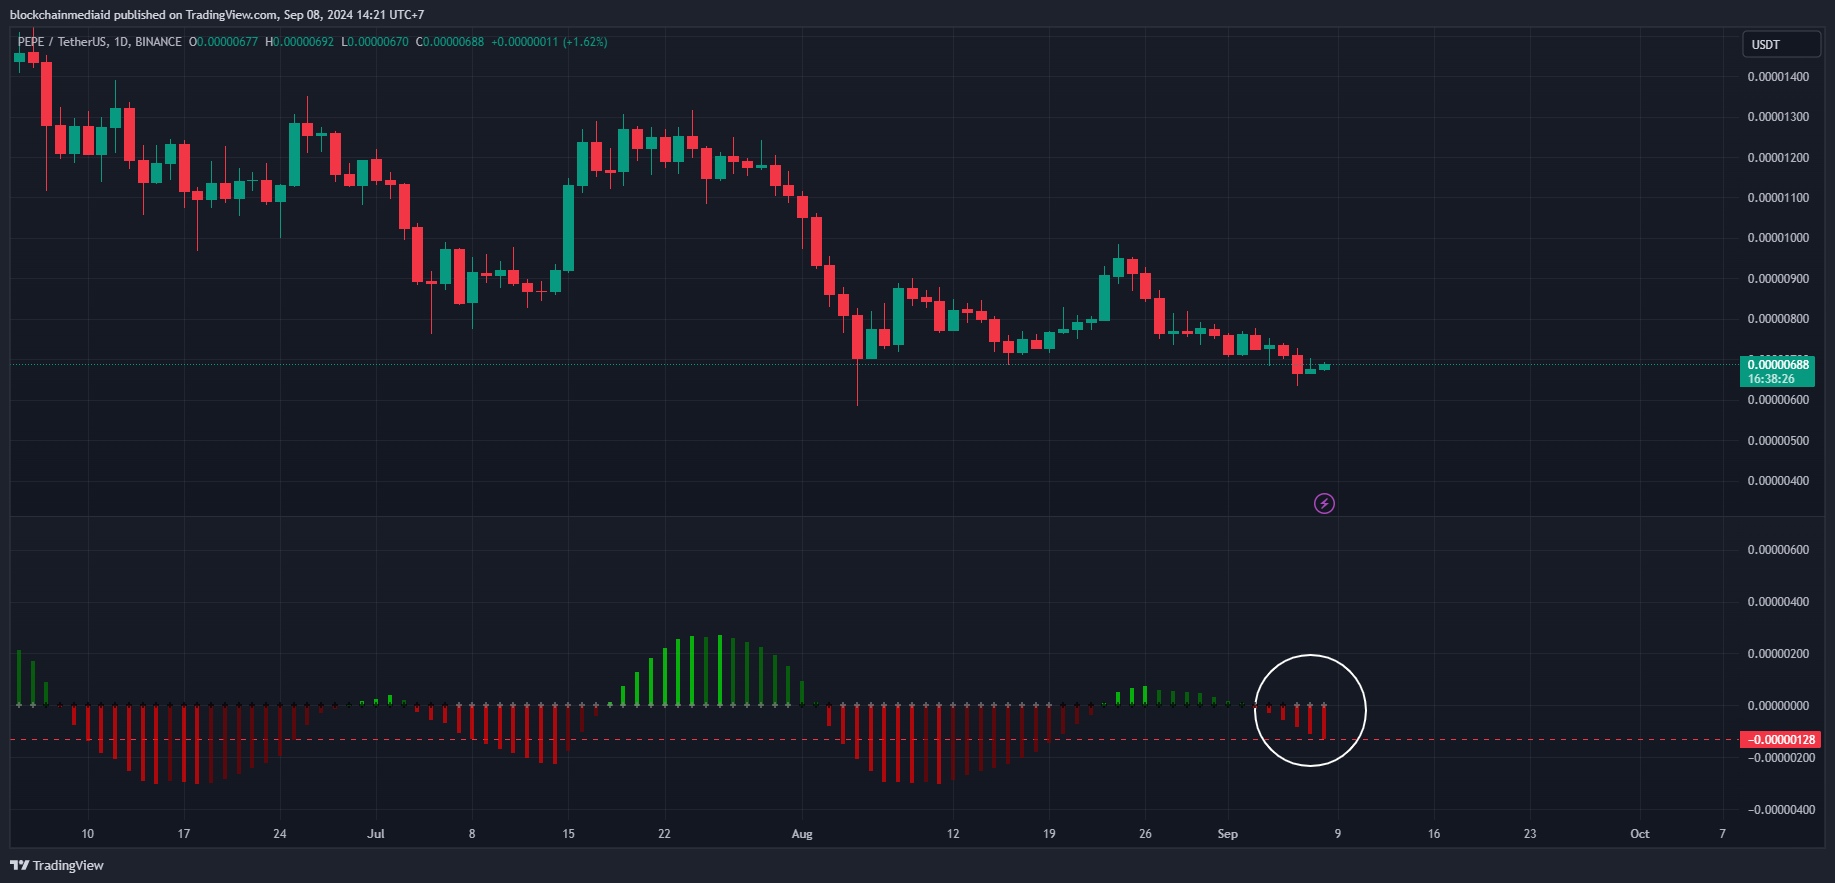
The Squeeze Momentum indicator, which measures the strength of PEPE's price movement, shows no sign of a reversal. Its current momentum value is at -0.000001280.
衡量 PEPE 价格走势强度的挤压动量指标没有显示出反转的迹象。其当前动量值为-0.000001280。

This adds to the negative momentum from the weekly time frame (see above), which has been in place since August 12, 2024. PEPE's momentum weakness intensified on June 10, 2024, after peaking the week before on June 3, 2024. This suggests that further declines are possible in the medium term.
这加剧了自 2024 年 8 月 12 日以来一直存在的每周时间框架(见上文)的负面势头。PEPE 的动量疲软在 2024 年 6 月 3 日达到前一周的峰值后,于 2024 年 6 月 10 日加剧。这表明中期内可能进一步下降。
Additional Analysis on 4-Hour and Daily Time Frames
4 小时和每日时间范围的附加分析
On the shorter 4-hour time frame, PEPE attempted to rally but remains in a downtrend after breaking below $0.00000766. It is currently trading below the 100-day Simple Moving Average (SMA). The current price is approaching the support level of $0.00000589, amidst continued negative market sentiment.
在较短的 4 小时时间范围内,PEPE 试图反弹,但在跌破 0.00000766 美元后仍处于下降趋势。目前其交易价格低于 100 日简单移动平均线 (SMA)。在市场情绪持续消极的情况下,当前价格正在接近 0.00000589 美元的支撑位。
The Relative Strength Index (RSI) indicator on the 4-hour chart shows a reading of 31%, indicating that PEPE is oversold. This suggests that the selling pressure could ease, allowing for a short-term bounce or consolidation if the bears do not remain dominant.
4小时图上的相对强弱指数(RSI)指标显示读数为31%,表明PEPE处于超卖状态。这表明,如果空头不再占据主导地位,抛售压力可能会缓解,从而允许短期反弹或盘整。
On the daily time frame, the bearish momentum is strong. After breaking below $0.00000766 and trading beneath the 100-day SMA, PEPE has faced significant selling. While there has been an attempt to recover, the rally is likely temporary as bearish sentiment prevails and weighs down on the price.
从日线图来看,看跌势头强劲。在跌破 0.00000766 美元并低于 100 日移动平均线后,PEPE 面临大量抛售。尽管有人试图复苏,但由于看跌情绪盛行并打压价格,反弹可能是暂时的。
The RSI on the daily chart is below 50% at 36%, confirming that PEPE remains under bearish pressure. This suggests that the bears are likely to regain control and push the price lower.
日线图上的 RSI 低于 50%,为 36%,证实 PEPE 仍面临看跌压力。这表明空头可能会重新获得控制权并压低价格。


 CoinoMedia
 Crypto News Land
 DogeHome
 CoinsProbe
 Optimisus
 Crypto News Land
 The Coin Republic


