Cover image via U.Today
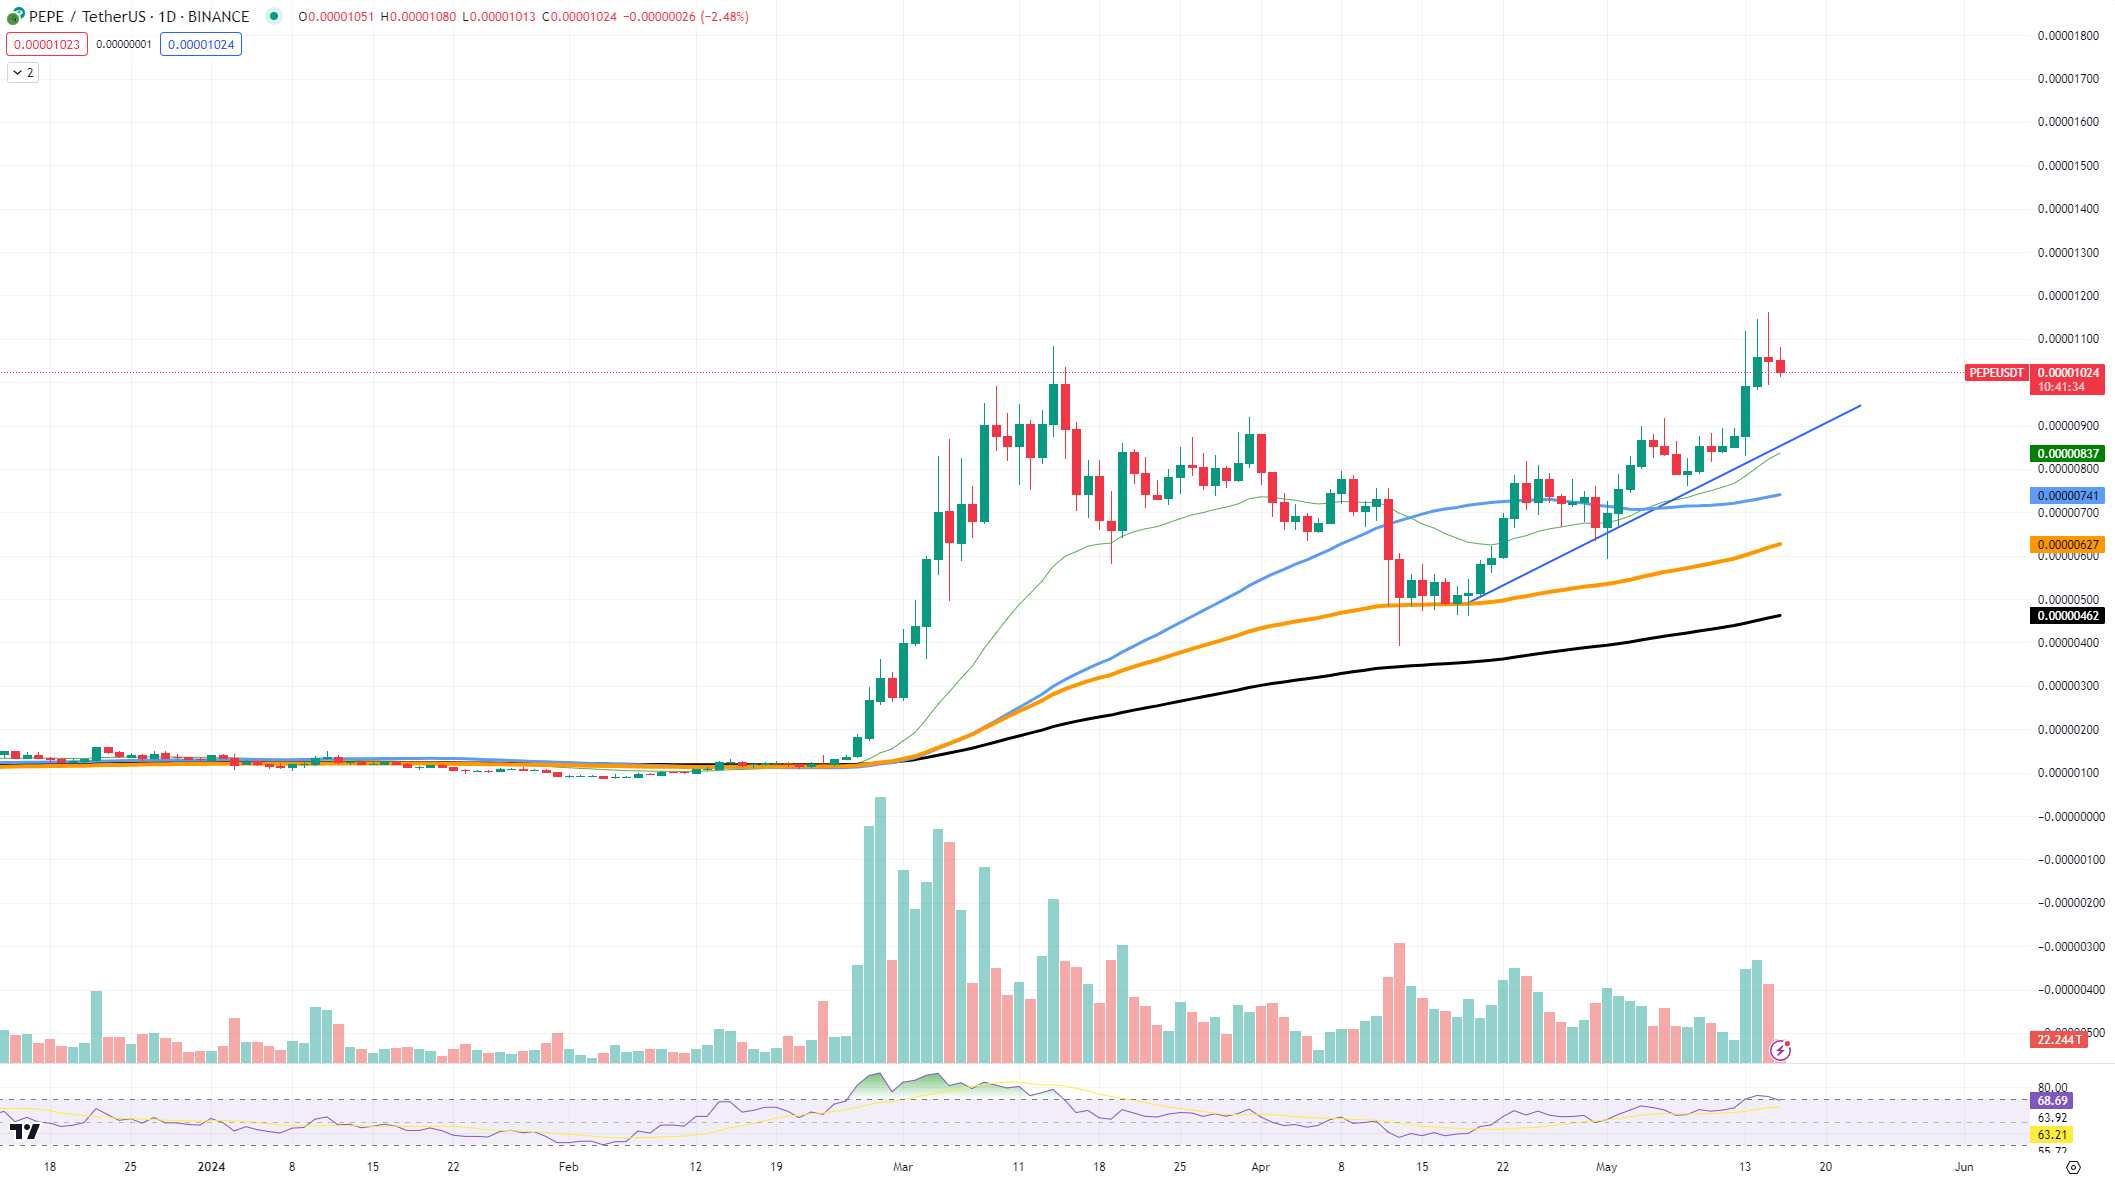
TradingView data reveals a substantial 21% surge for PEPE in recent days. The asset has breached the $0.00001 threshold and aims to surpass its all-time high. Key indicators to monitor include:
- Moving averages support: The 50, 100, and 200 EMAs are trending upwards, providing a solid foundation for PEPE's bullish trajectory.
- Ascending trendline: This trendline has acted as a reliable support level, ensuring PEPE's upward momentum.
 PEPE/USDT Chart by TradingView
 - Momentum indicators (RSI): The RSI is approaching the overbought zone, suggesting potential short-term pauses before further gains. However, as long as it remains above the midline, the bullish trend should persist.
Volume: The increase in volume indicates strong buying interest, which is crucial for sustaining the bull run.
Shiba Inu's Revitalization:
Shiba Inu faces a crucial resistance level at the 50 EMA. Recent price action suggests buyers' determination to overcome this barrier. With room for growth, SHIB requires one final push.
- Volume surge: Increased trading volume is a positive sign, indicating buying interest among investors.
- Market recovery: The overall market recovery remains a key factor for SHIB's success.
- Breakthrough potential: A successful breakout would signal the start of a more extended upward movement.
Solana's Breakthrough:
Solana has broken through a key resistance level, establishing a foothold above the 50 EMA.
- **$160 threshold:** Solana has surpassed the $160 price point, requiring bullish conviction to maintain its momentum.
- Resistance levels: Solana faces resistance at $175 and $190, historical resistance levels.
- Support level: Support is likely around $145, a previous price reversal point.
- Volume: Increased trading volume indicates strong buying interest, which is necessary for the uptrend to continue.
- RSI: The RSI hovers around the midline, suggesting potential for further upward momentum.
Solana's recent breakout above the 50 EMA and the $160 mark is a bullish sign. With increased trading volume and positive RSI indicators, the outlook appears promising. The $175 and $190 resistance levels, as well as volume, are crucial factors to watch. If Solana maintains this momentum, it could potentially reach even higher price levels.


 TheNewsCrypto
 CFN
CFN DogeHome
 Optimisus
 Crypto News Land
 Optimisus
 Cryptopolitan_News


