Cover image via U.Today
U.Today를 통한 표지 이미지
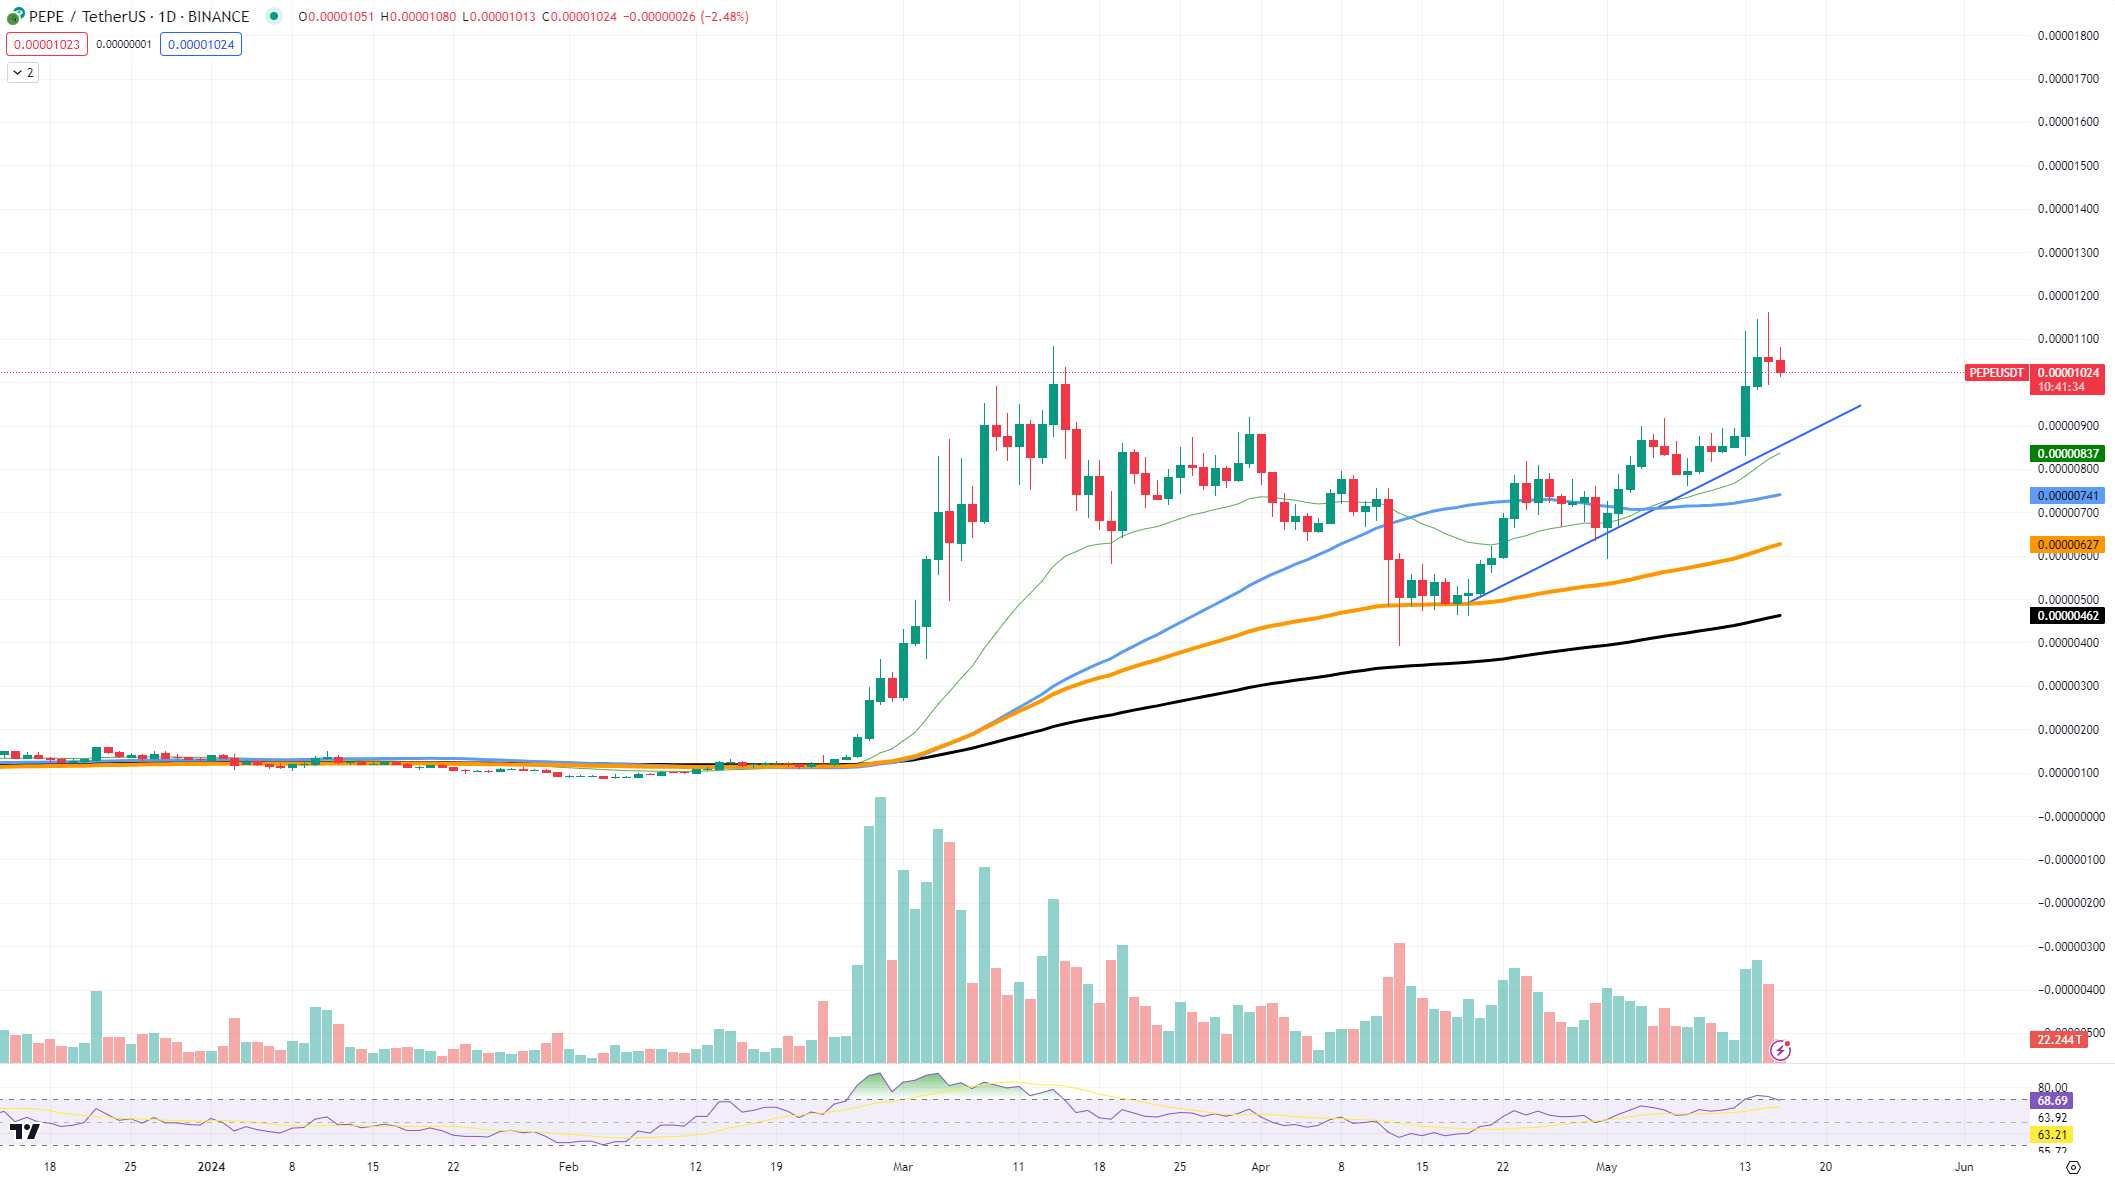
TradingView data reveals a substantial 21% surge for PEPE in recent days. The asset has breached the $0.00001 threshold and aims to surpass its all-time high. Key indicators to monitor include:
TradingView 데이터에 따르면 최근 며칠 동안 PEPE가 21%나 급등한 것으로 나타났습니다. 해당 자산은 $0.00001 기준점을 돌파했으며 사상 최고치를 넘어서는 것을 목표로 하고 있습니다. 모니터링해야 할 주요 지표는 다음과 같습니다.
- Moving averages support: The 50, 100, and 200 EMAs are trending upwards, providing a solid foundation for PEPE's bullish trajectory.
- Ascending trendline: This trendline has acted as a reliable support level, ensuring PEPE's upward momentum.
 PEPE/USDT Chart by TradingView
 - Momentum indicators (RSI): The RSI is approaching the overbought zone, suggesting potential short-term pauses before further gains. However, as long as it remains above the midline, the bullish trend should persist.
Volume: The increase in volume indicates strong buying interest, which is crucial for sustaining the bull run.
이동 평균 지원: 50, 100 및 200 EMA는 상승 추세를 보이고 있으며 PEPE의 강세 궤적에 대한 견고한 기반을 제공합니다. 상승 추세선: 이 추세선은 안정적인 지지 수준 역할을 하여 PEPE의 상승 모멘텀을 보장합니다. TradingViewMomentum 지표(RSI)의 PEPE/USDT 차트: RSI가 과매수 영역에 접근하고 있으며, 추가 상승 전 일시적인 일시 정지 가능성을 시사합니다. 그러나 중앙선 위에 머무르는 한 강세 추세는 지속될 것입니다. 거래량: 거래량의 증가는 강한 매수 관심을 나타내며 이는 상승세를 유지하는 데 중요합니다.
Shiba Inu's Revitalization:
시바견의 부활:
Shiba Inu faces a crucial resistance level at the 50 EMA. Recent price action suggests buyers' determination to overcome this barrier. With room for growth, SHIB requires one final push.
Shiba Inu는 50 EMA에서 중요한 저항 수준에 직면해 있습니다. 최근의 가격 움직임은 이러한 장벽을 극복하려는 구매자의 결의를 시사합니다. 성장의 여지가 있는 SHIB에는 마지막 추진이 필요합니다.
- Volume surge: Increased trading volume is a positive sign, indicating buying interest among investors.
- Market recovery: The overall market recovery remains a key factor for SHIB's success.
- Breakthrough potential: A successful breakout would signal the start of a more extended upward movement.
Solana's Breakthrough:
거래량 급등: 거래량 증가는 투자자들의 매수 관심을 나타내는 긍정적인 신호입니다. 시장 회복: 전반적인 시장 회복은 여전히 SHIB 성공의 핵심 요소입니다. 돌파 가능성: 성공적인 돌파는 더욱 확장된 상승 움직임의 시작을 의미합니다. 솔라나의 돌파구:
Solana has broken through a key resistance level, establishing a foothold above the 50 EMA.
솔라나는 주요 저항선을 돌파하여 50 EMA 위에 발판을 마련했습니다.
- **$160 threshold:** Solana has surpassed the $160 price point, requiring bullish conviction to maintain its momentum.
- Resistance levels: Solana faces resistance at $175 and $190, historical resistance levels.
- Support level: Support is likely around $145, a previous price reversal point.
- Volume: Increased trading volume indicates strong buying interest, which is necessary for the uptrend to continue.
- RSI: The RSI hovers around the midline, suggesting potential for further upward momentum.
Solana's recent breakout above the 50 EMA and the $160 mark is a bullish sign. With increased trading volume and positive RSI indicators, the outlook appears promising. The $175 and $190 resistance levels, as well as volume, are crucial factors to watch. If Solana maintains this momentum, it could potentially reach even higher price levels.
**$160 임계값:** 솔라나는 $160 가격대를 넘어섰으며 모멘텀을 유지하려면 강세 확신이 필요합니다. 저항 수준: 솔라나는 역사적 저항 수준인 $175와 $190에서 저항에 직면합니다. 지원 수준: 이전 가격인 약 $145에서 지지를 받을 가능성이 높습니다. 반전 지점입니다. 거래량: 거래량 증가는 강한 매수 관심을 의미하며, 이는 상승 추세가 지속되기 위해 필요합니다. RSI: RSI가 중간선을 맴돌고 있어 추가 상승 모멘텀이 있음을 암시합니다. 솔라나의 최근 50 EMA와 $160를 돌파한 것은 다음과 같습니다. 강세 신호. 거래량이 증가하고 RSI 지표가 긍정적이어서 전망은 유망해 보입니다. 175달러와 190달러의 저항 수준과 거래량은 주목해야 할 중요한 요소입니다. 솔라나가 이러한 추진력을 유지한다면 잠재적으로 더 높은 가격 수준에 도달할 수 있습니다.


 TheNewsCrypto
 CFN
CFN DogeHome
 Optimisus
 Crypto News Land
 Optimisus
 Cryptopolitan_News


