Cover image via U.Today
封面图片来自 U.Today
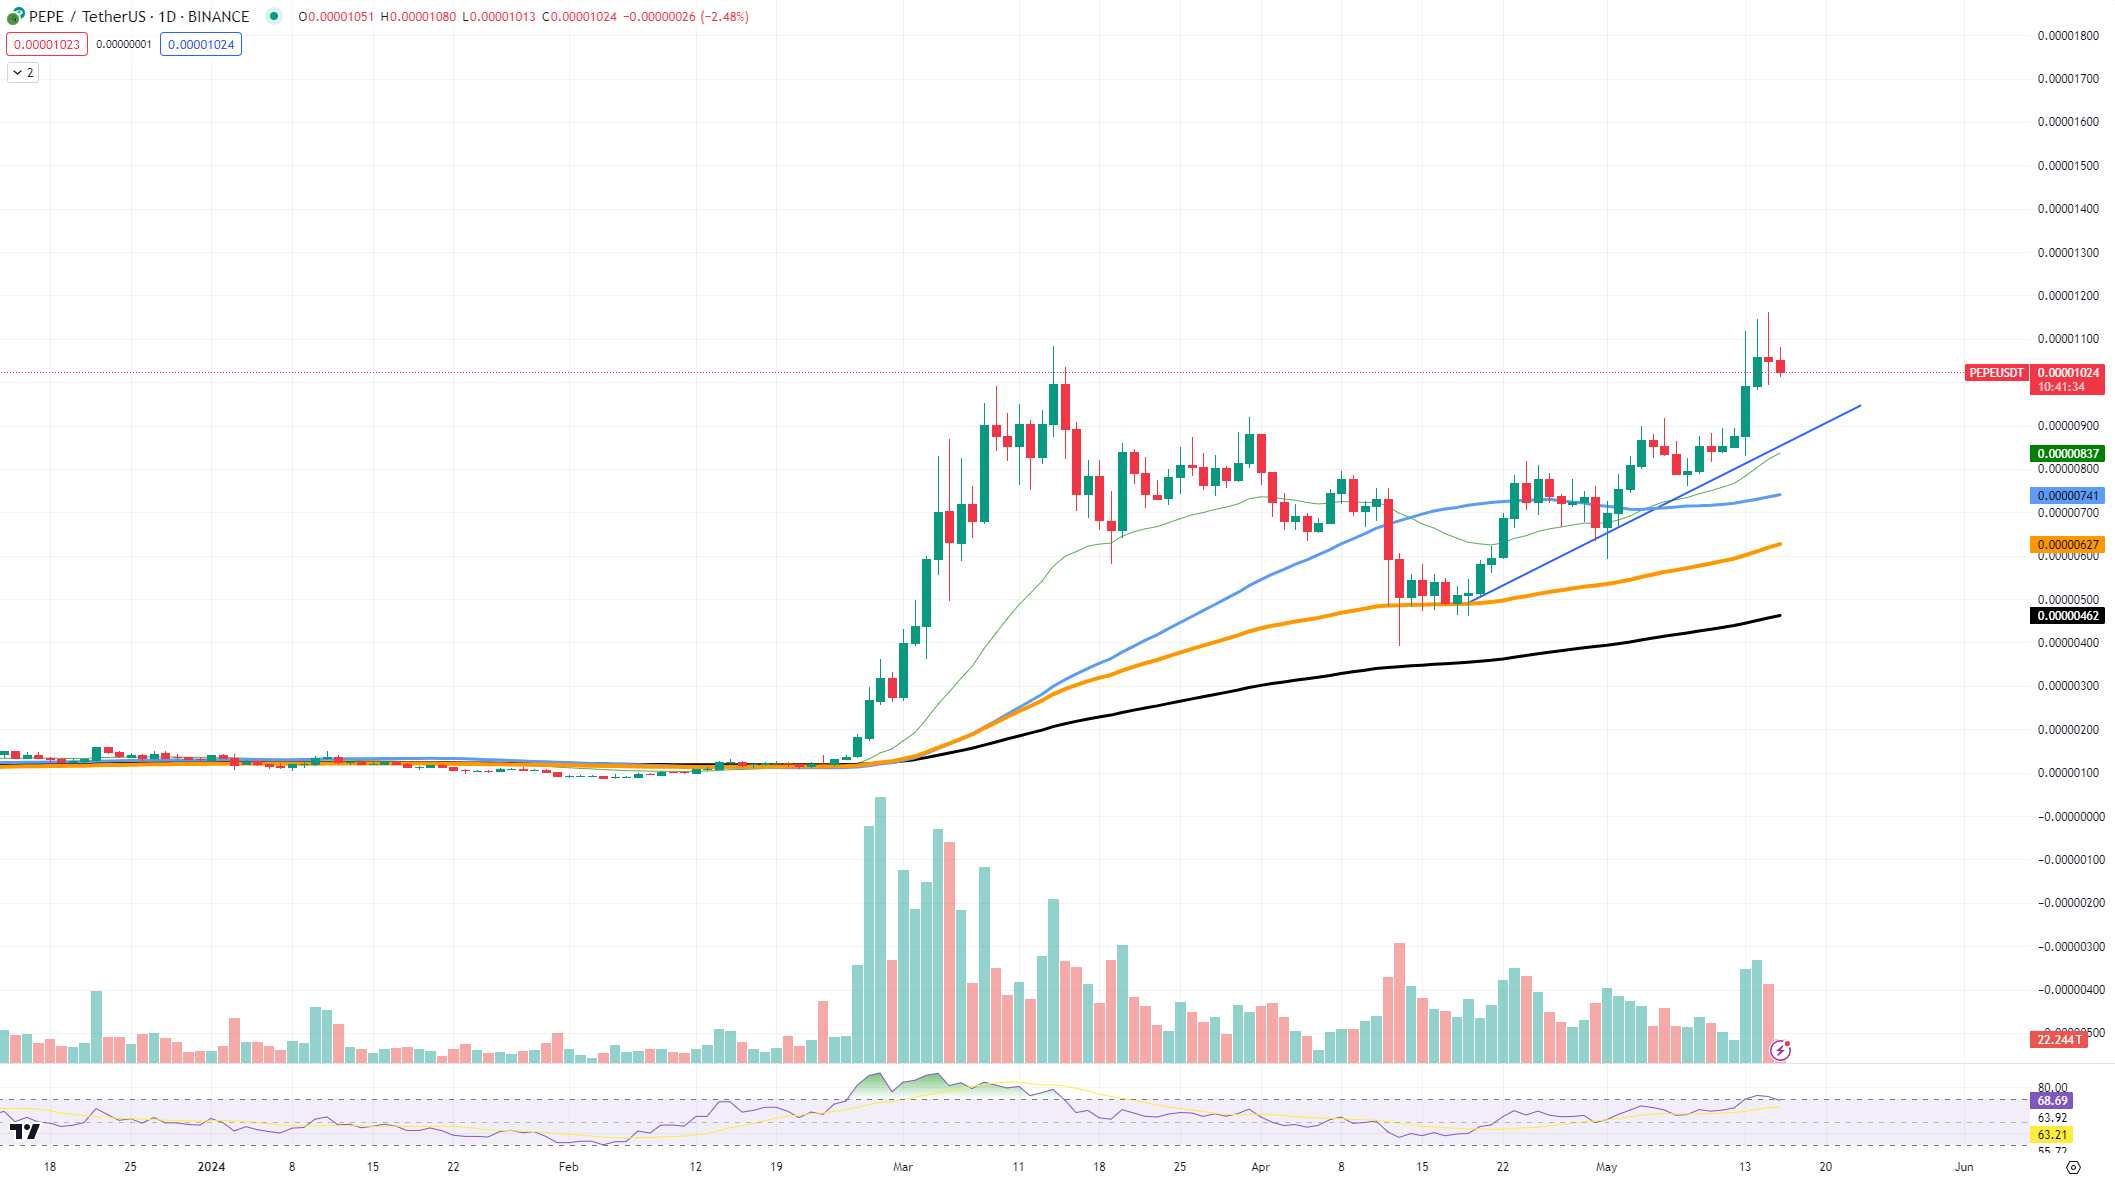
TradingView data reveals a substantial 21% surge for PEPE in recent days. The asset has breached the $0.00001 threshold and aims to surpass its all-time high. Key indicators to monitor include:
TradingView 数据显示,最近几天 PEPE 大幅上涨 21%。该资产已突破 0.00001 美元的门槛,并有望超越其历史新高。需要监控的关键指标包括:
- Moving averages support: The 50, 100, and 200 EMAs are trending upwards, providing a solid foundation for PEPE's bullish trajectory.
- Ascending trendline: This trendline has acted as a reliable support level, ensuring PEPE's upward momentum.
 PEPE/USDT Chart by TradingView
 - Momentum indicators (RSI): The RSI is approaching the overbought zone, suggesting potential short-term pauses before further gains. However, as long as it remains above the midline, the bullish trend should persist.
Volume: The increase in volume indicates strong buying interest, which is crucial for sustaining the bull run.
均线支撑:50、100、200 EMA均呈上升趋势,为PEPE的看涨轨迹提供了坚实的基础。上升趋势线:该趋势线充当了可靠的支撑位,确保了PEPE的上升动力。 PEPE/USDT 图表(由 TradingView 提供)动量指标 (RSI):RSI 正在接近超买区域,表明在进一步上涨之前可能会出现短期暂停。不过,只要保持在中线上方,看涨趋势就应该持续。 成交量:成交量的增加表明买盘兴趣强劲,这对于维持牛市至关重要。
Shiba Inu's Revitalization:
柴犬的复兴:
Shiba Inu faces a crucial resistance level at the 50 EMA. Recent price action suggests buyers' determination to overcome this barrier. With room for growth, SHIB requires one final push.
Shiba Inu 面临着 50 EMA 的关键阻力位。最近的价格走势表明买家决心克服这一障碍。有了增长空间,SHIB 需要最后一搏。
- Volume surge: Increased trading volume is a positive sign, indicating buying interest among investors.
- Market recovery: The overall market recovery remains a key factor for SHIB's success.
- Breakthrough potential: A successful breakout would signal the start of a more extended upward movement.
Solana's Breakthrough:
交易量激增:交易量增加是一个积极信号,表明投资者有购买兴趣。市场复苏:整体市场复苏仍然是 SHIB 成功的关键因素。突破潜力:成功突破将标志着更广泛的上涨趋势的开始。Solana 的突破:
Solana has broken through a key resistance level, establishing a foothold above the 50 EMA.
Solana 已突破关键阻力位,在 50 EMA 上方站稳脚跟。
- **$160 threshold:** Solana has surpassed the $160 price point, requiring bullish conviction to maintain its momentum.
- Resistance levels: Solana faces resistance at $175 and $190, historical resistance levels.
- Support level: Support is likely around $145, a previous price reversal point.
- Volume: Increased trading volume indicates strong buying interest, which is necessary for the uptrend to continue.
- RSI: The RSI hovers around the midline, suggesting potential for further upward momentum.
Solana's recent breakout above the 50 EMA and the $160 mark is a bullish sign. With increased trading volume and positive RSI indicators, the outlook appears promising. The $175 and $190 resistance levels, as well as volume, are crucial factors to watch. If Solana maintains this momentum, it could potentially reach even higher price levels.
**160 美元门槛:** Solana 已超过 160 美元价格点,需要看涨信念来维持其势头。阻力位:Solana 面临历史阻力位 175 美元和 190 美元的阻力。支撑位:支撑位可能约为 145 美元(之前的价格)反转点。成交量:成交量增加表明买盘兴趣浓厚,这是上涨趋势持续的必要条件。RSI:RSI 徘徊在中线附近,表明有进一步上涨动力的潜力。Solana 最近突破 50 EMA 和 160 美元关口看涨信号。随着交易量的增加和积极的 RSI 指标,前景似乎充满希望。 175 美元和 190 美元的阻力位以及成交量是值得关注的关键因素。如果 Solana 保持这种势头,它可能会达到更高的价格水平。


 BlockchainReporter
 TheNewsCrypto
 CFN
CFN DogeHome
 Optimisus
 Crypto News Land
 Optimisus
 Cryptopolitan_News


