Cover image via U.Today
カバー画像(U.Today経由)
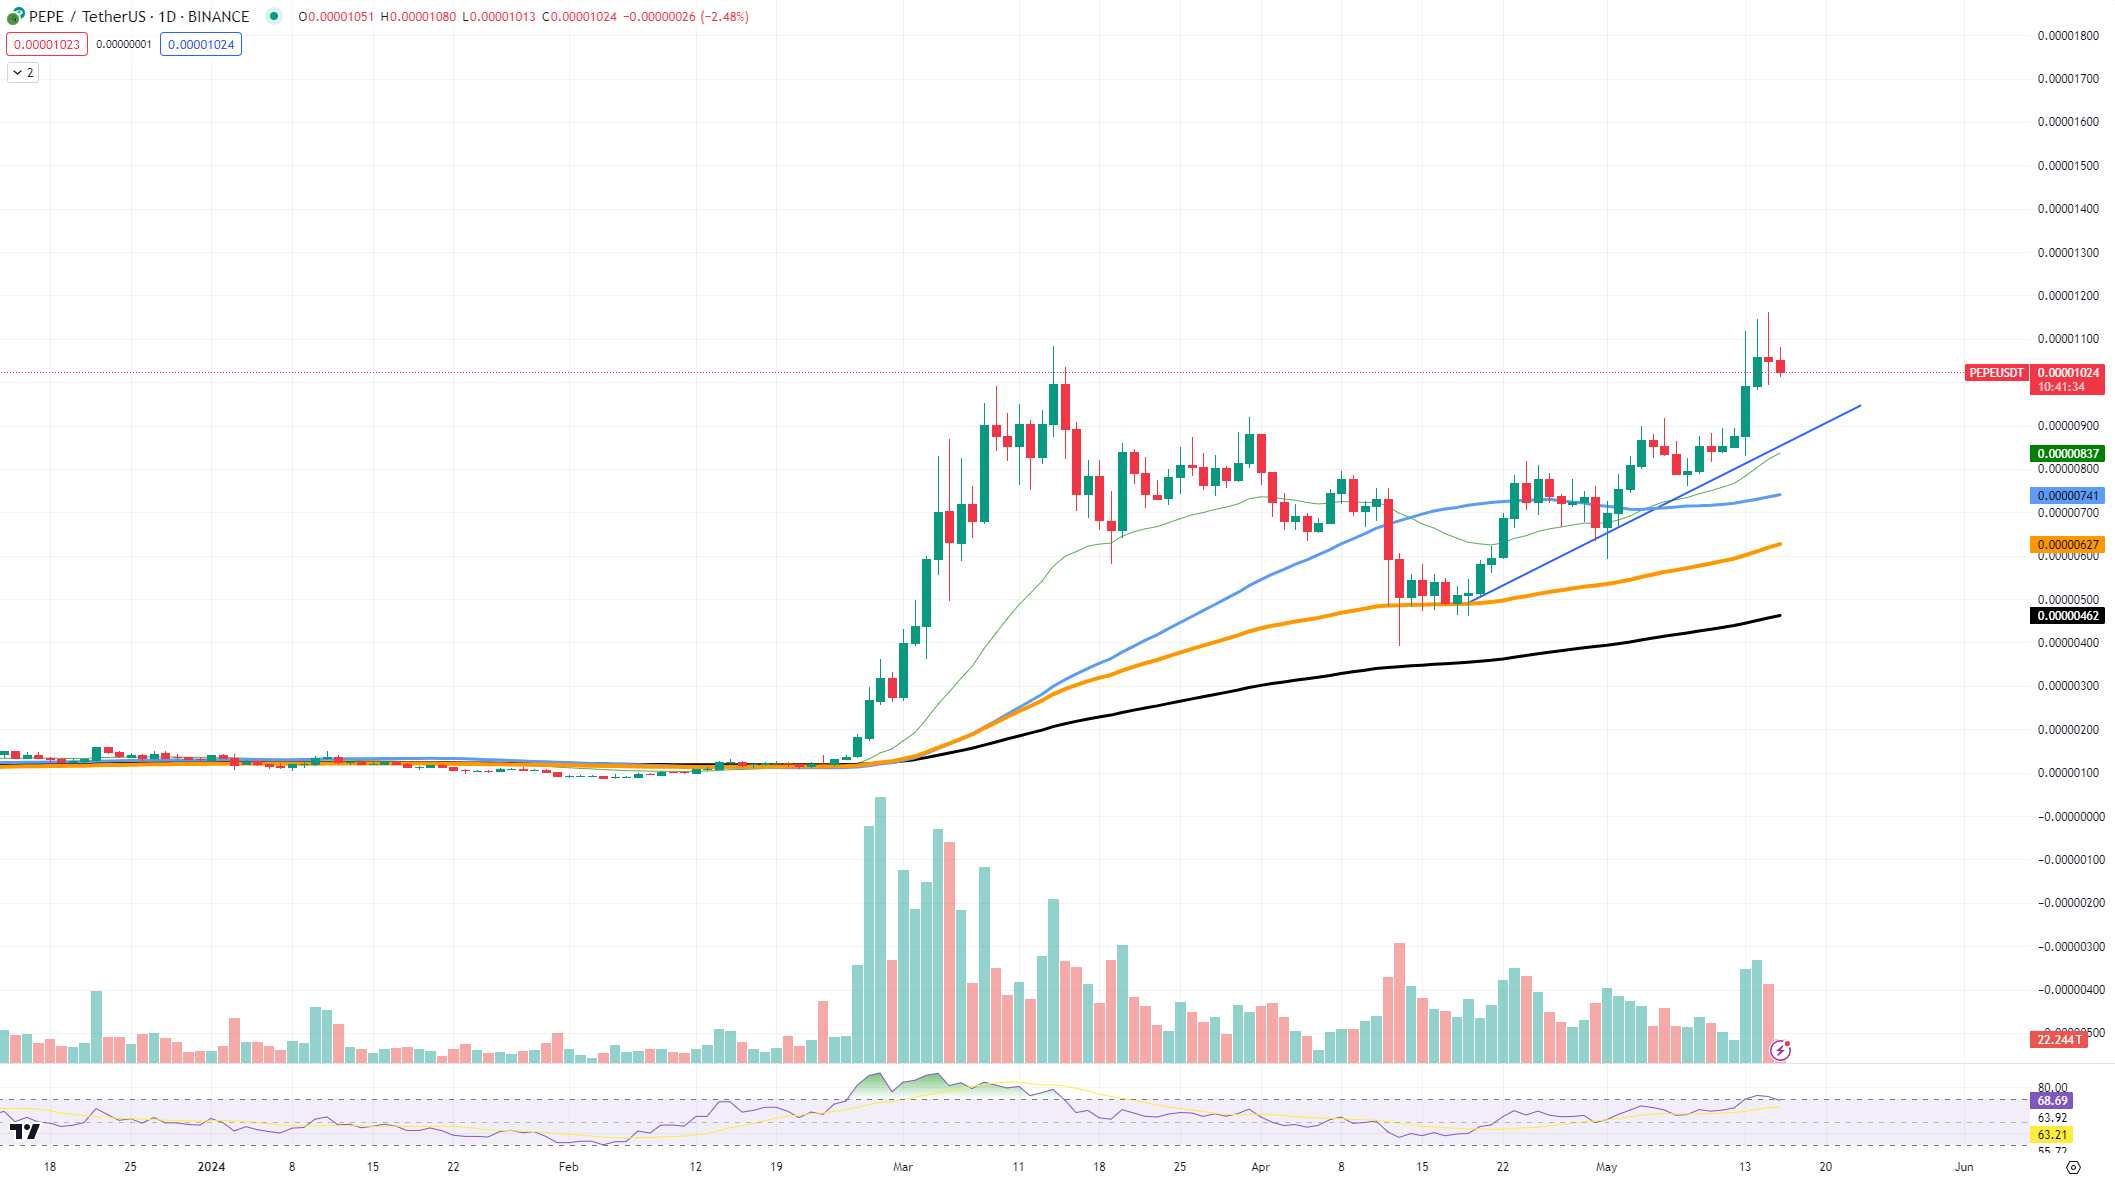
TradingView data reveals a substantial 21% surge for PEPE in recent days. The asset has breached the $0.00001 threshold and aims to surpass its all-time high. Key indicators to monitor include:
TradingViewのデータによると、ここ数日でPEPEが21%大幅に上昇したことが明らかになりました。この資産は 0.00001 ドルのしきい値を突破し、史上最高値を超えることを目指しています。監視すべき主な指標には次のものがあります。
- Moving averages support: The 50, 100, and 200 EMAs are trending upwards, providing a solid foundation for PEPE's bullish trajectory.
- Ascending trendline: This trendline has acted as a reliable support level, ensuring PEPE's upward momentum.
 PEPE/USDT Chart by TradingView
 - Momentum indicators (RSI): The RSI is approaching the overbought zone, suggesting potential short-term pauses before further gains. However, as long as it remains above the midline, the bullish trend should persist.
Volume: The increase in volume indicates strong buying interest, which is crucial for sustaining the bull run.
移動平均線のサポート: 50、100、および 200 EMA は上昇傾向にあり、PEPE の強気軌道に強固な基盤を提供します。上昇トレンドライン: このトレンドラインは信頼できるサポート レベルとして機能し、PEPE の上向きの勢いを確保します。 TradingViewMomentum指標によるPEPE/USDTチャート(RSI):RSIは買われ過ぎゾーンに近づいており、さらなる上昇の前に短期的に一時停止する可能性を示唆しています。ただし、正中線を上回っている限り、強気傾向は続くはずです。 出来高: 出来高の増加は強い購入意欲を示しており、これは強気相場を維持するために非常に重要です。
Shiba Inu's Revitalization:
柴犬の元気化:
Shiba Inu faces a crucial resistance level at the 50 EMA. Recent price action suggests buyers' determination to overcome this barrier. With room for growth, SHIB requires one final push.
柴犬は50EMAで重大な抵抗レベルに直面しています。最近の価格動向は、この障壁を乗り越えようとする買い手の決意を示唆しています。成長の余地がある SHIB には最後の一押しが必要です。
- Volume surge: Increased trading volume is a positive sign, indicating buying interest among investors.
- Market recovery: The overall market recovery remains a key factor for SHIB's success.
- Breakthrough potential: A successful breakout would signal the start of a more extended upward movement.
Solana's Breakthrough:
出来高の急増: 取引量の増加は投資家の買い意欲を示す明るい兆しです。市場の回復: 市場全体の回復が引き続き SHIB の成功の重要な要素です。ブレイクスルーの可能性: ブレイクアウトの成功は、より長期にわたる上昇相場の始まりを示すでしょう。ソラナの画期的な進歩:
Solana has broken through a key resistance level, establishing a foothold above the 50 EMA.
ソラナは重要な抵抗レベルを突破し、50EMAを超える足場を確立しました。
- **$160 threshold:** Solana has surpassed the $160 price point, requiring bullish conviction to maintain its momentum.
- Resistance levels: Solana faces resistance at $175 and $190, historical resistance levels.
- Support level: Support is likely around $145, a previous price reversal point.
- Volume: Increased trading volume indicates strong buying interest, which is necessary for the uptrend to continue.
- RSI: The RSI hovers around the midline, suggesting potential for further upward momentum.
Solana's recent breakout above the 50 EMA and the $160 mark is a bullish sign. With increased trading volume and positive RSI indicators, the outlook appears promising. The $175 and $190 resistance levels, as well as volume, are crucial factors to watch. If Solana maintains this momentum, it could potentially reach even higher price levels.
**160ドルの閾値:** ソラナは160ドルの価格ポイントを超えており、その勢いを維持するには強気の信念が必要です。レジスタンスレベル: ソラナは歴史的なレジスタンスレベルである175ドルと190ドルのレジスタンスに直面しています。サポートレベル: サポートはおそらく以前の価格である145ドル付近です。反転ポイント。出来高: 取引高の増加は、上昇傾向の継続に必要な強い購入意欲を示しています。RSI: RSI は正中線付近を推移しており、さらなる上昇の勢いの可能性を示唆しています。ソラナの最近のブレイクアウトは 50 EMA と 160 ドルのマークです。強気のサイン。取引量の増加とRSI指標の好調により、見通しは有望に見えます。 175 ドルと 190 ドルの抵抗レベルと出来高は、注目すべき重要な要素です。ソラナがこの勢いを維持すれば、さらに高い価格水準に達する可能性があります。


 DogeHome
 BlockchainReporter
 CoinPedia News
 TheNewsCrypto
 CFN
CFN Optimisus
 Crypto News Land


