Shiba Inu Price Analysis: Poised for a Reversal Rally
Amidst the anticipation of Bitcoin crossing $60K and the potential Ethereum ETF listing, meme coins are surging. Despite the recent pullback in Dogecoin and Shiba Inu, the overall market recovery could spark a reversal rally. Will this recovery sustain a trend reversal for Shiba Inu in the coming week?
Shiba Inu Price Analysis: SHIB Below 200-Day EMA, Poised to Break Out

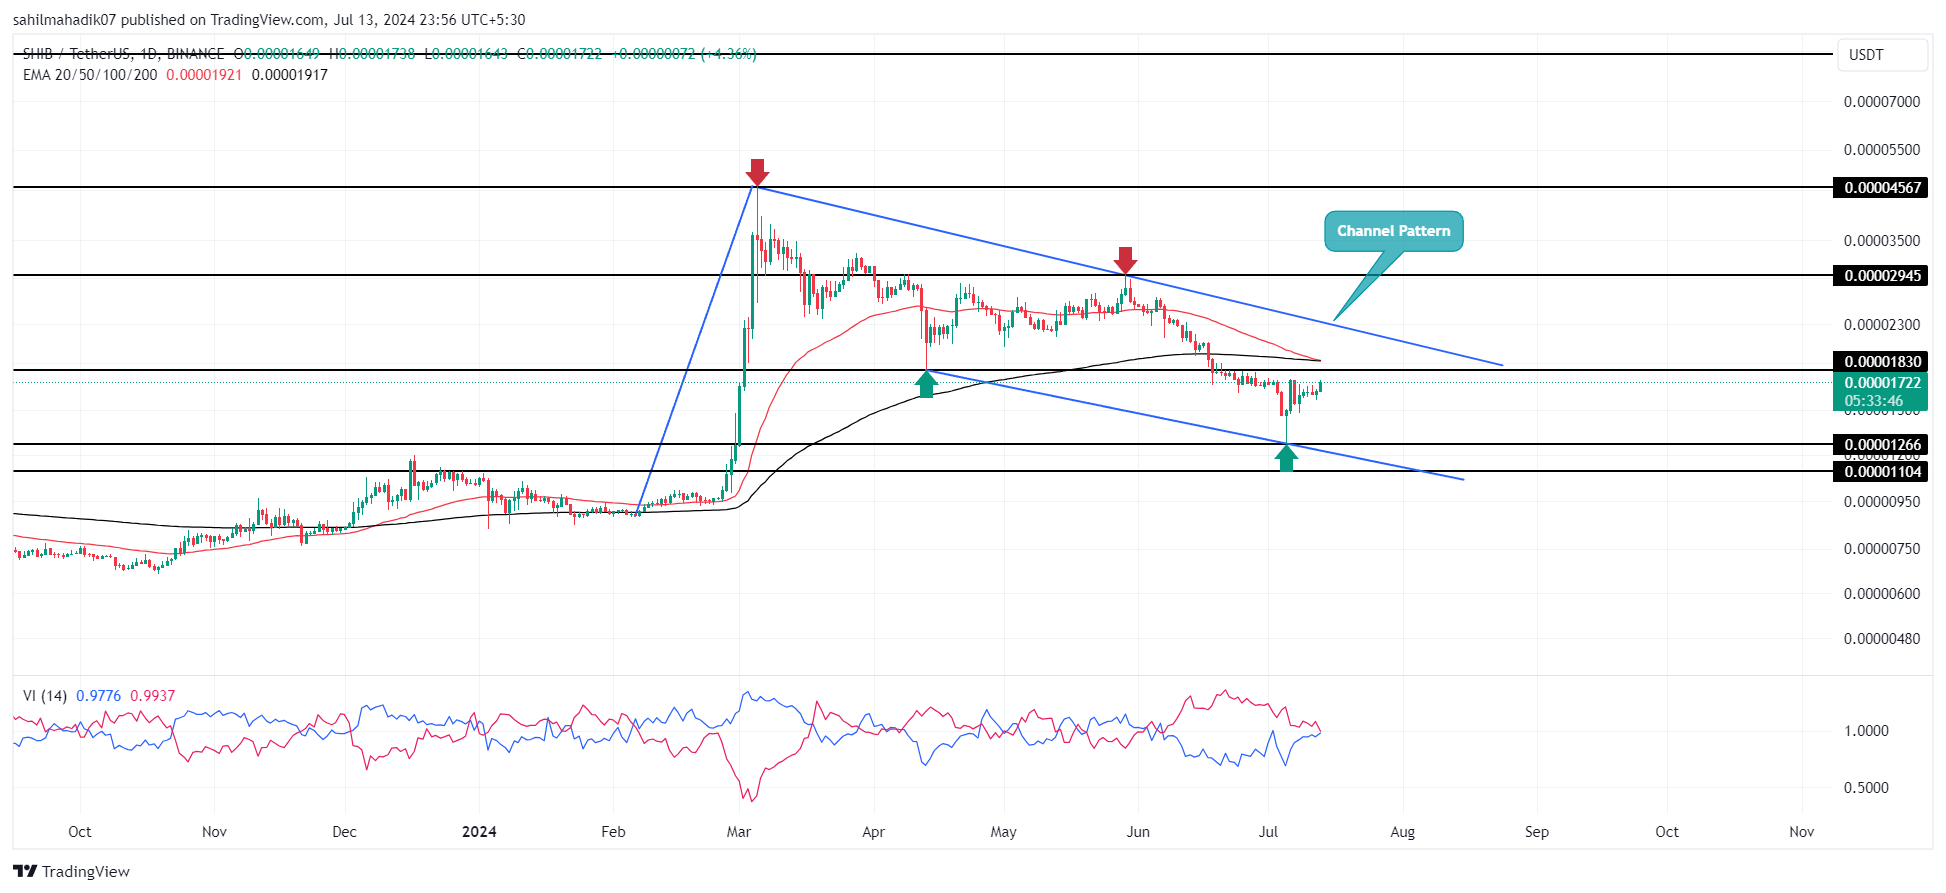
Shiba Inu Price Analysis | Tradingview
Trailing a clear downtrend, Shiba Inu has fallen below the 200-day EMA. Following its late February surge, a pullback has formed a channel on the daily chart.
Channel patterns typically indicate a gradual decline between downward-sloping trendlines. However, trends can shift, and SHIB may break out of this pattern.
The sharp decline has reduced SHIB's value by 22% over 30 days. This correction has brought the 50-day and 200-day EMAs near a death cross signal. SHIB currently trades at $0.0000172, up 4.4% intraday, with a market cap of $10.14 billion.
Burn rate data from Shibburn reveals a 325% surge today, attributed to the burning of 2.87 million coins in 24 hours.
Shiba Inu Price Analysis: Bull Cycle and Breakout Potential
The broader market recovery has sparked a bull cycle for Shiba Inu, with a 14.8% gain over the past week.
If this bull cycle persists, SHIB could reach its overhead trendline near $0.00002. A breakout could lead to target zones of $0.00003 and $0.0000456.
However, caution is advised due to the bearish channel and the potential death cross signal.
Technical Indicator:
- Moving Average Convergence Divergence: With a bullish reversal, the MACD (blue) and signal lines (orange) approach the zero line, and positive histograms are rising.
- Exponential Moving Average: A potential bearish crossover between the 50D and 200D EMA could prolong the current correction trend.


 Cryptopolitan_News
 Coin Edition
 BlockchainReporter
 crypto.news
 Crypto Daily™
 BlockchainReporter
 Optimisus
 DogeHome
 Crypto News Land


