Shiba Inu Price Analysis: Poised for a Reversal Rally
柴犬の価格分析:反転上昇の準備が整っている
Amidst the anticipation of Bitcoin crossing $60K and the potential Ethereum ETF listing, meme coins are surging. Despite the recent pullback in Dogecoin and Shiba Inu, the overall market recovery could spark a reversal rally. Will this recovery sustain a trend reversal for Shiba Inu in the coming week?
ビットコインが6万ドルを超えるとの期待とイーサリアムETF上場の可能性の中で、ミームコインが急騰している。最近のドージコインと柴犬の反動にもかかわらず、市場全体の回復は反転上昇を引き起こす可能性がある。この回復は来週の柴犬の傾向反転を維持するでしょうか?
Shiba Inu Price Analysis: SHIB Below 200-Day EMA, Poised to Break Out
柴犬の価格分析:SHIBは200日EMAを下回り、ブレイクアウトの準備が整っている

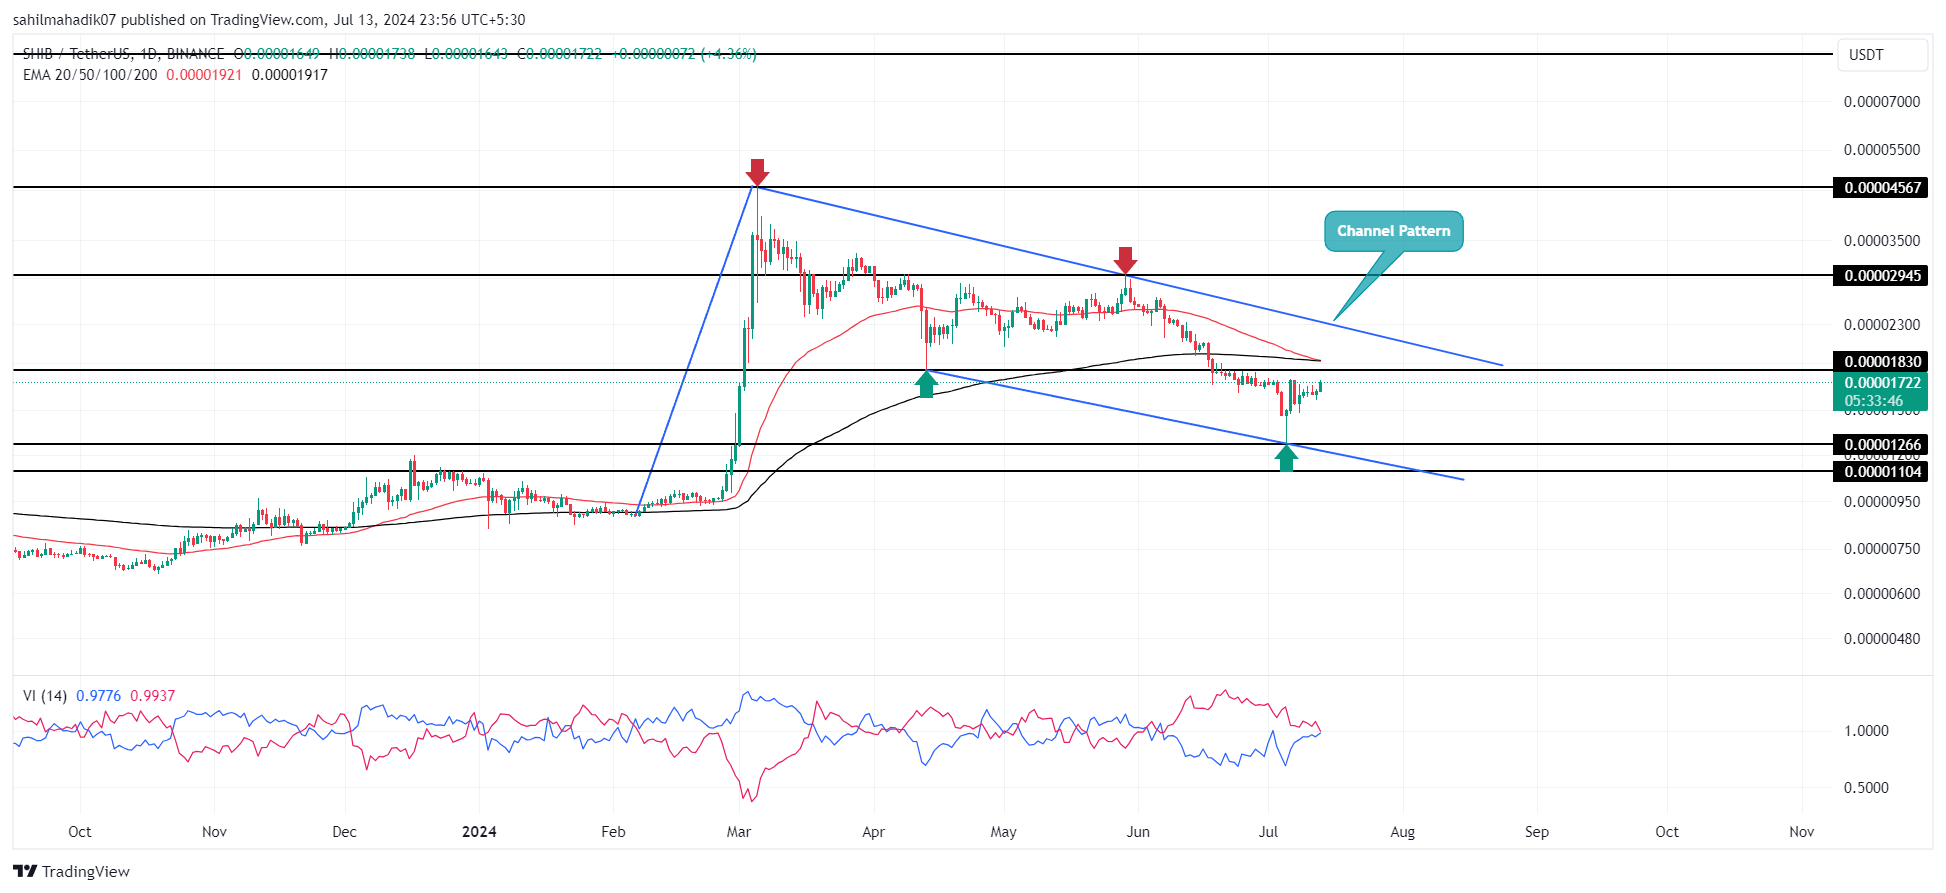
Shiba Inu Price Analysis | Tradingview
柴犬の価格分析 |トレーディングビュー
Trailing a clear downtrend, Shiba Inu has fallen below the 200-day EMA. Following its late February surge, a pullback has formed a channel on the daily chart.
明らかな下降傾向をたどり、柴犬は 200 日 EMA を下回りました。 2月下旬の急騰に続き、日足チャートに反落チャネルが形成された。
Channel patterns typically indicate a gradual decline between downward-sloping trendlines. However, trends can shift, and SHIB may break out of this pattern.
チャネル パターンは通常、下向きのトレンドラインの間で徐々に減少していることを示します。ただし、トレンドが変化する可能性があり、SHIB がこのパターンから抜け出す可能性があります。
The sharp decline has reduced SHIB's value by 22% over 30 days. This correction has brought the 50-day and 200-day EMAs near a death cross signal. SHIB currently trades at $0.0000172, up 4.4% intraday, with a market cap of $10.14 billion.
急激な下落により、SHIBの価値は30日間で22%減少した。この調整により、50日EMAと200日EMAは死のクロスシグナルに近づいた。 SHIBは現在、日中4.4%上昇の0.0000172ドルで取引されており、時価総額は101億4000万ドルとなっている。
Burn rate data from Shibburn reveals a 325% surge today, attributed to the burning of 2.87 million coins in 24 hours.
Shibburn の燃焼率データによると、24 時間で 287 万枚のコインが燃焼したことにより、今日 325% の急増が明らかになりました。
Shiba Inu Price Analysis: Bull Cycle and Breakout Potential
柴犬の価格分析:強気サイクルとブレイクアウトの可能性
The broader market recovery has sparked a bull cycle for Shiba Inu, with a 14.8% gain over the past week.
広範な市場の回復は柴犬の強気サイクルを引き起こし、過去 1 週間で 14.8% 増加しました。
If this bull cycle persists, SHIB could reach its overhead trendline near $0.00002. A breakout could lead to target zones of $0.00003 and $0.0000456.
この強気サイクルが続けば、SHIBは0.00002ドル付近の諸経費トレンドラインに達する可能性がある。ブレイクアウトにより、ターゲット ゾーンは $0.00003 と $0.0000456 になる可能性があります。
However, caution is advised due to the bearish channel and the potential death cross signal.
ただし、弱気チャネルと潜在的な死のクロスシグナルがあるため、注意が必要です。
Technical Indicator:
テクニカル指標:
- Moving Average Convergence Divergence: With a bullish reversal, the MACD (blue) and signal lines (orange) approach the zero line, and positive histograms are rising.
- Exponential Moving Average: A potential bearish crossover between the 50D and 200D EMA could prolong the current correction trend.
移動平均の収束ダイバージェンス: 強気の反転により、MACD (青) とシグナルライン (オレンジ) がゼロラインに近づき、正のヒストグラムが上昇しています。指数移動平均: 50D と 200D EMA の間の弱気クロスオーバーの可能性により、現在の相場が長引く可能性があります。修正傾向。


 Crypto Daily™
 BlockchainReporter
 TheCoinrise Media
 DogeHome
 Crypto Daily™
 Crypto Daily™
 TheCoinrise Media
 Thecoinrepublic.com


