Shiba Inu Price Analysis: Poised for a Reversal Rally
柴犬价格分析:准备逆转反弹
Amidst the anticipation of Bitcoin crossing $60K and the potential Ethereum ETF listing, meme coins are surging. Despite the recent pullback in Dogecoin and Shiba Inu, the overall market recovery could spark a reversal rally. Will this recovery sustain a trend reversal for Shiba Inu in the coming week?
在比特币突破 6 万美元以及以太坊 ETF 上市的预期中,迷因币正在飙升。尽管狗狗币和柴犬最近出现回调,但整体市场复苏可能引发逆转反弹。这种复苏会在未来一周维持柴犬的趋势逆转吗?
Shiba Inu Price Analysis: SHIB Below 200-Day EMA, Poised to Break Out
柴犬价格分析:SHIB 低于 200 日均线,准备突破

Shiba Inu Price Analysis | Tradingview
柴犬价格分析|交易视图
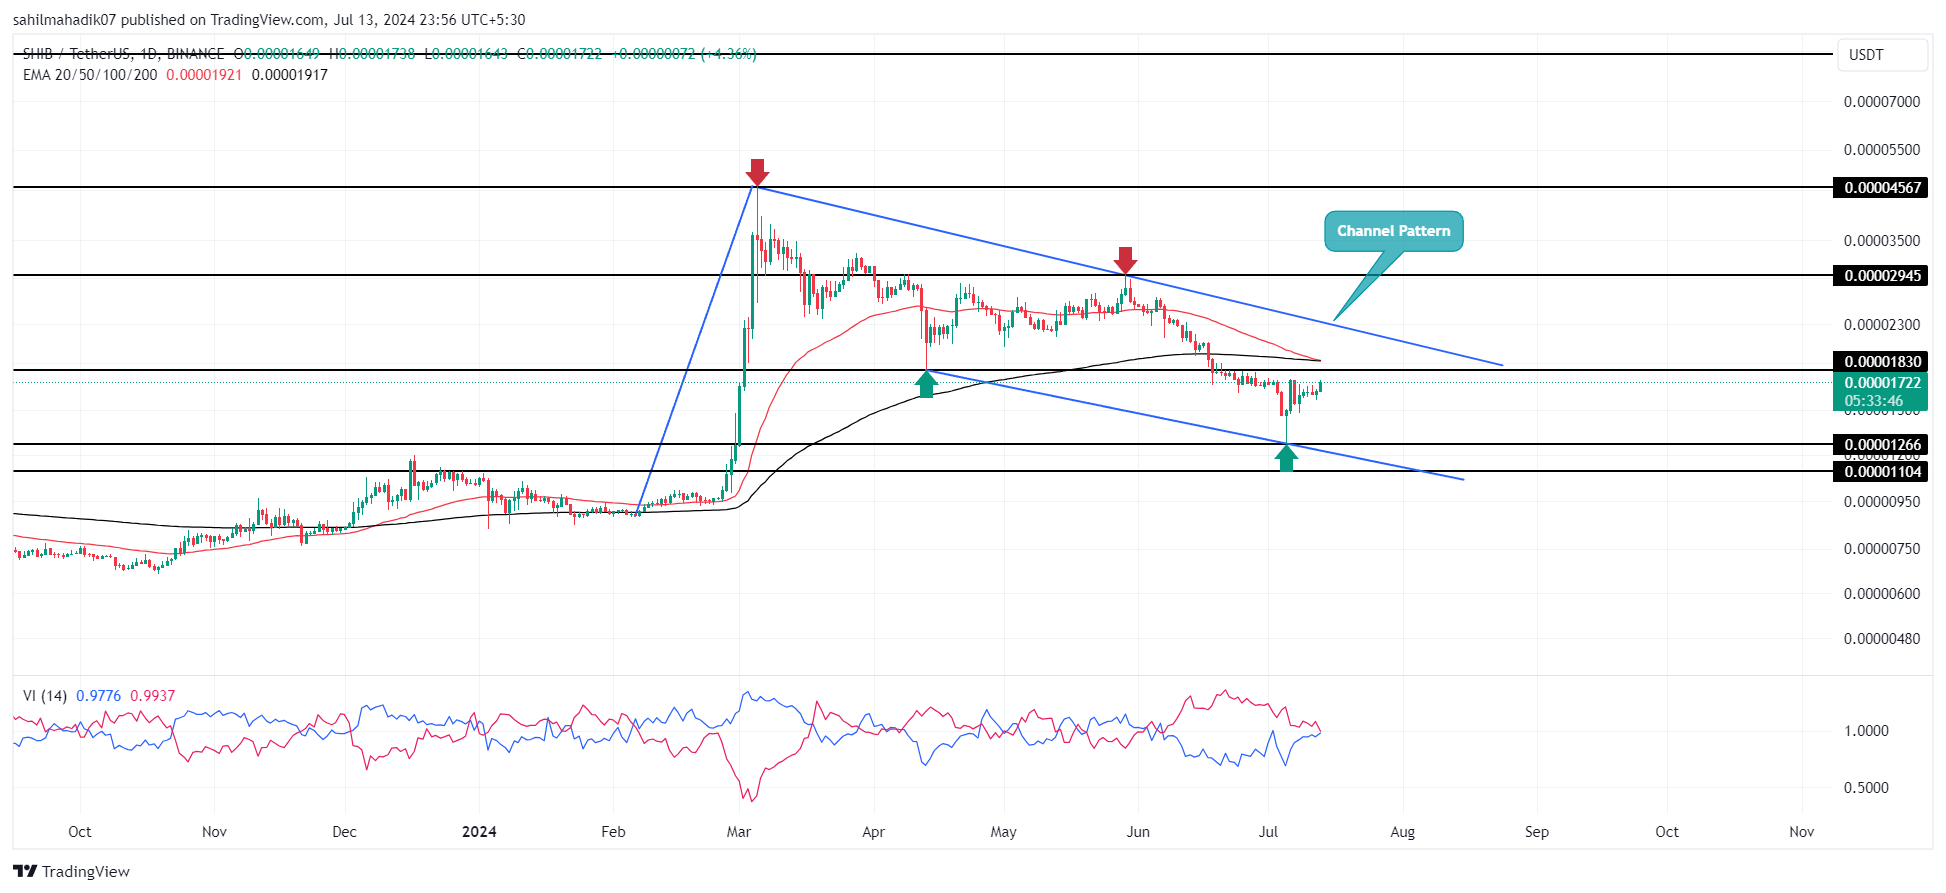
Trailing a clear downtrend, Shiba Inu has fallen below the 200-day EMA. Following its late February surge, a pullback has formed a channel on the daily chart.
跟随明显的下降趋势,柴犬已跌破 200 日均线。继二月底的飙升之后,回调已在日线图上形成了一个通道。
Channel patterns typically indicate a gradual decline between downward-sloping trendlines. However, trends can shift, and SHIB may break out of this pattern.
通道模式通常表明向下倾斜的趋势线之间逐渐下降。然而,趋势可能会发生变化,SHIB 可能会打破这种模式。
The sharp decline has reduced SHIB's value by 22% over 30 days. This correction has brought the 50-day and 200-day EMAs near a death cross signal. SHIB currently trades at $0.0000172, up 4.4% intraday, with a market cap of $10.14 billion.
急剧下跌导致 SHIB 的价值在 30 天内下跌了 22%。此次调整使 50 日和 200 日均线接近死亡交叉信号。 SHIB目前交易价格为0.0000172美元,盘中上涨4.4%,市值为101.4亿美元。
Burn rate data from Shibburn reveals a 325% surge today, attributed to the burning of 2.87 million coins in 24 hours.
Shibburn 的销毁率数据显示,今天的销毁率激增 325%,归因于 24 小时内销毁了 287 万枚代币。
Shiba Inu Price Analysis: Bull Cycle and Breakout Potential
柴犬价格分析:牛市周期和突破潜力
The broader market recovery has sparked a bull cycle for Shiba Inu, with a 14.8% gain over the past week.
大盘复苏引发了柴犬的牛市周期,过去一周上涨了 14.8%。
If this bull cycle persists, SHIB could reach its overhead trendline near $0.00002. A breakout could lead to target zones of $0.00003 and $0.0000456.
如果这个牛市周期持续下去,SHIB 可能会达到 0.00002 美元附近的上方趋势线。突破可能导致目标区域为 0.00003 美元和 0.0000456 美元。
However, caution is advised due to the bearish channel and the potential death cross signal.
然而,由于看跌通道和潜在的死亡交叉信号,建议谨慎。
Technical Indicator:
技术指标:
- Moving Average Convergence Divergence: With a bullish reversal, the MACD (blue) and signal lines (orange) approach the zero line, and positive histograms are rising.
- Exponential Moving Average: A potential bearish crossover between the 50D and 200D EMA could prolong the current correction trend.
移动平均线收敛背离:随着看涨反转,MACD(蓝色)和信号线(橙色)接近零线,正向柱状图正在上升。指数移动平均线:50D 和 200D EMA 之间潜在的看跌交叉可能会延长当前的趋势修正趋势。


 Crypto Daily™
 BlockchainReporter
 TheCoinrise Media
 DogeHome
 Crypto Daily™
 Crypto Daily™
 TheCoinrise Media
 Thecoinrepublic.com


