Shiba Inu Price Analysis: Poised for a Reversal Rally
시바견 가격 분석: 반전 랠리 준비
Amidst the anticipation of Bitcoin crossing $60K and the potential Ethereum ETF listing, meme coins are surging. Despite the recent pullback in Dogecoin and Shiba Inu, the overall market recovery could spark a reversal rally. Will this recovery sustain a trend reversal for Shiba Inu in the coming week?
비트코인이 6만 달러를 넘을 것이라는 기대와 이더리움 ETF 상장 가능성이 있는 가운데 밈 코인이 급증하고 있습니다. 최근 Dogecoin과 Shiba Inu의 하락세에도 불구하고 전반적인 시장 회복은 반전 랠리를 촉발할 수 있습니다. 이러한 회복이 다음 주에 Shiba Inu의 추세 반전을 유지할 수 있습니까?
Shiba Inu Price Analysis: SHIB Below 200-Day EMA, Poised to Break Out
시바견 가격 분석: 200일 EMA 이하의 SHIB, 돌파 준비

Shiba Inu Price Analysis | Tradingview
시바견 가격 분석 | 트레이딩뷰
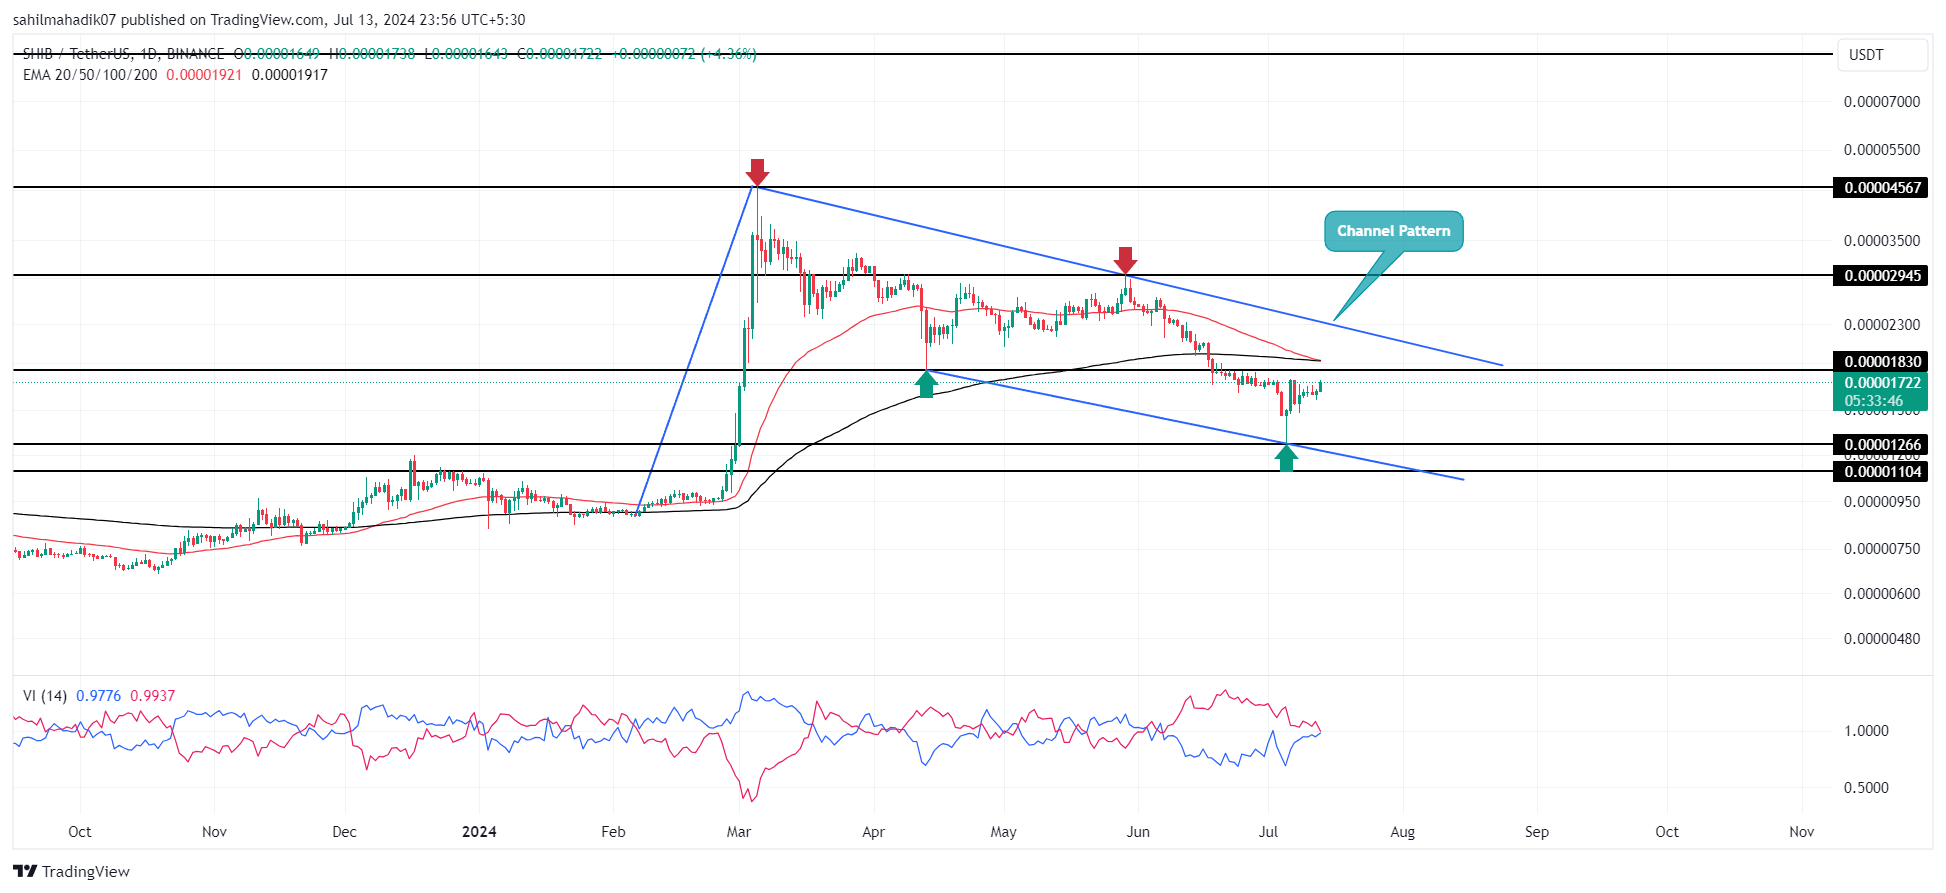
Trailing a clear downtrend, Shiba Inu has fallen below the 200-day EMA. Following its late February surge, a pullback has formed a channel on the daily chart.
뚜렷한 하락세를 보인 시바견은 200일 EMA 아래로 떨어졌습니다. 2월 말 급등 이후 하락세로 인해 일일 차트에 채널이 형성되었습니다.
Channel patterns typically indicate a gradual decline between downward-sloping trendlines. However, trends can shift, and SHIB may break out of this pattern.
채널 패턴은 일반적으로 하향 추세선 사이의 점진적인 하락을 나타냅니다. 그러나 추세는 바뀔 수 있으며 SHIB는 이러한 패턴에서 벗어날 수 있습니다.
The sharp decline has reduced SHIB's value by 22% over 30 days. This correction has brought the 50-day and 200-day EMAs near a death cross signal. SHIB currently trades at $0.0000172, up 4.4% intraday, with a market cap of $10.14 billion.
급격한 하락으로 인해 SHIB의 가치는 30일 동안 22% 감소했습니다. 이러한 조정으로 인해 50일 EMA와 200일 EMA가 데드 크로스 신호에 가까워졌습니다. SHIB는 현재 장중 4.4% 상승한 $0.0000172에 거래되고 있으며 시가총액은 101억 4천만 달러입니다.
Burn rate data from Shibburn reveals a 325% surge today, attributed to the burning of 2.87 million coins in 24 hours.
Shibburn의 소각률 데이터는 24시간 동안 287만 개의 코인이 소각되었기 때문에 오늘 325%의 급증을 보여줍니다.
Shiba Inu Price Analysis: Bull Cycle and Breakout Potential
시바견 가격 분석: 강세 주기 및 돌파 가능성
The broader market recovery has sparked a bull cycle for Shiba Inu, with a 14.8% gain over the past week.
광범위한 시장 회복으로 인해 시바견의 상승 사이클이 촉발되었으며 지난 주 동안 14.8%의 상승률을 기록했습니다.
If this bull cycle persists, SHIB could reach its overhead trendline near $0.00002. A breakout could lead to target zones of $0.00003 and $0.0000456.
이 강세 주기가 지속된다면 SHIB는 $0.00002 근처의 오버헤드 추세선에 도달할 수 있습니다. 돌파는 $0.00003 및 $0.0000456의 목표 영역으로 이어질 수 있습니다.
However, caution is advised due to the bearish channel and the potential death cross signal.
다만 하락채널과 데드크로스 신호 가능성이 있어 주의가 필요합니다.
Technical Indicator:
기술 지표:
- Moving Average Convergence Divergence: With a bullish reversal, the MACD (blue) and signal lines (orange) approach the zero line, and positive histograms are rising.
- Exponential Moving Average: A potential bearish crossover between the 50D and 200D EMA could prolong the current correction trend.
이동 평균 수렴 발산: 강세 반전으로 MACD(파란색)와 신호 선(주황색)이 0선에 접근하고 양수 히스토그램이 상승하고 있습니다. 지수 이동 평균: 50D와 200D EMA 사이의 잠재적인 약세 교차로 인해 현재 추세가 연장될 수 있습니다. 교정 추세.


 DogeHome
 crypto.news
 The Bit Journal
 Crypto Daily™
 Crypto Daily™
 Crypto Daily™
 crypto.ro English
 Optimisus


