Solana Surges to New Highs, Defies Market Downturn
Solana (SOL) has soared to a new all-time high of $294.33, defying the recent bearish trend in the cryptocurrency market. Despite a slight dip, SOL remains in the green, currently trading at around $243.
Despite its remarkable surge, SOL has not entirely escaped the market's pullback. Market analysts anticipate that it will soon approach the $400 mark. Currently, SOL boasts a market capitalization of approximately $118 billion.
The altcoin began the day at $266.29, reaching its peak before experiencing a sharp decline to $231.63. Notably, it has faced liquidations worth $110.83 million over the past 24 hours, resulting in a daily trading volume of $35 billion.
Over the past week, SOL has climbed over 34%, commencing at $183.24 and steadily ascending to its current level.
Technical Analysis: Bearish Correction Underway
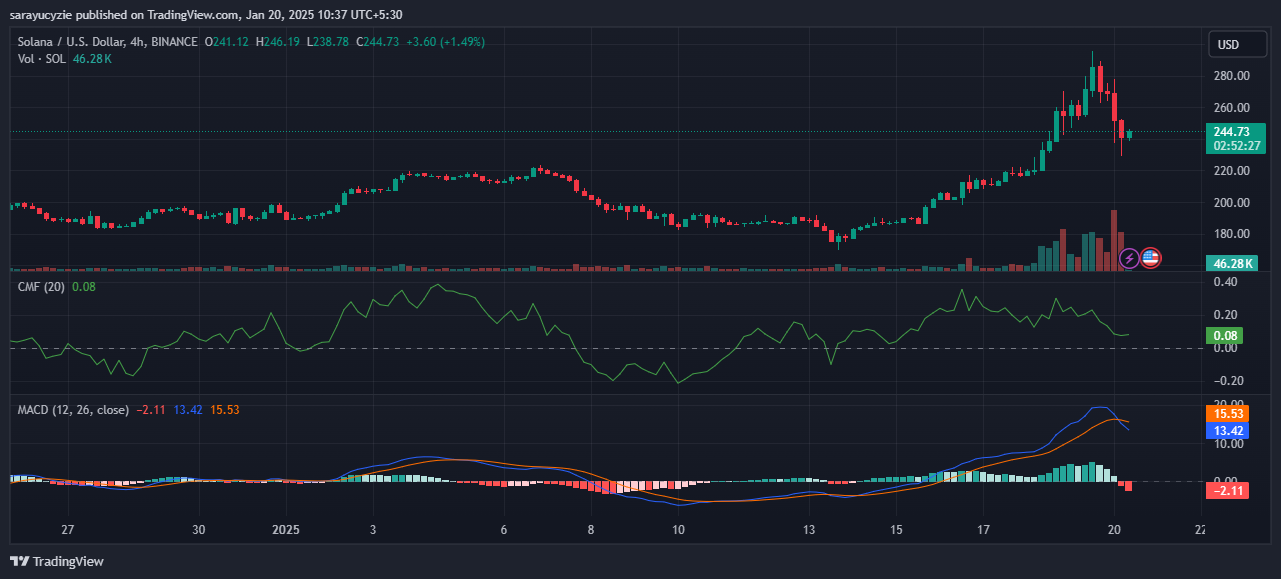
Solana's four-hour trading chart reveals a downside correction in progress. SOL currently trades 16.78% below its all-time high, with support at $240.63 being crucial. If bearish pressure persists, the altcoin may fall to $235, potentially extending losses even lower.
Conversely, if momentum shifts, Solana could challenge the resistance level at $246.88, signaling a brief bullish outlook. Breaking above this mark could elevate the asset above $250, potentially bringing it closer to its all-time high.
Technical indicators for SOL suggest bearish momentum, with the Moving Average Convergence Divergence (MACD) line below the signal line, indicating a potential sell signal. However, the Chaikin Money Flow (CMF) remains positive at 0.08, suggesting moderate buying pressure.
Solana's daily relative strength index (RSI) is at 53.77, indicating a neutral position. Additionally, the daily frame shows the short-term 9-day moving average above the long-term 21-day moving average.


 Cryptopolitan_News
 Optimisus
 DogeHome
 Optimisus
 Optimisus
 BlockchainReporter
 BlockchainReporter
 Optimisus


