Solana Surges to New Highs, Defies Market Downturn
Solana 飆升至新高,克服市場低迷
Solana (SOL) has soared to a new all-time high of $294.33, defying the recent bearish trend in the cryptocurrency market. Despite a slight dip, SOL remains in the green, currently trading at around $243.
Solana (SOL) 飆升至 294.33 美元的歷史新高,打破了加密貨幣市場近期的看跌趨勢。儘管小幅下跌,SOL 仍處於綠色狀態,目前交易價格約為 243 美元。
Despite its remarkable surge, SOL has not entirely escaped the market's pullback. Market analysts anticipate that it will soon approach the $400 mark. Currently, SOL boasts a market capitalization of approximately $118 billion.
儘管 SOL 大幅上漲,但仍未完全擺脫市場回檔。市場分析師預計很快就會逼近 400 美元大關。目前,SOL 的市值約為 1,180 億美元。
The altcoin began the day at $266.29, reaching its peak before experiencing a sharp decline to $231.63. Notably, it has faced liquidations worth $110.83 million over the past 24 hours, resulting in a daily trading volume of $35 billion.
該山寨幣當天開盤價為 266.29 美元,達到峰值,然後急劇下跌至 231.63 美元。值得注意的是,過去 24 小時內面臨價值 1.1083 億美元的清算,導致每日交易量達到 350 億美元。
Over the past week, SOL has climbed over 34%, commencing at $183.24 and steadily ascending to its current level.
過去一周,SOL 上漲了 34% 以上,從 183.24 美元開始,穩步升至當前水準。
Technical Analysis: Bearish Correction Underway
技術分析:看跌修正正在進行中
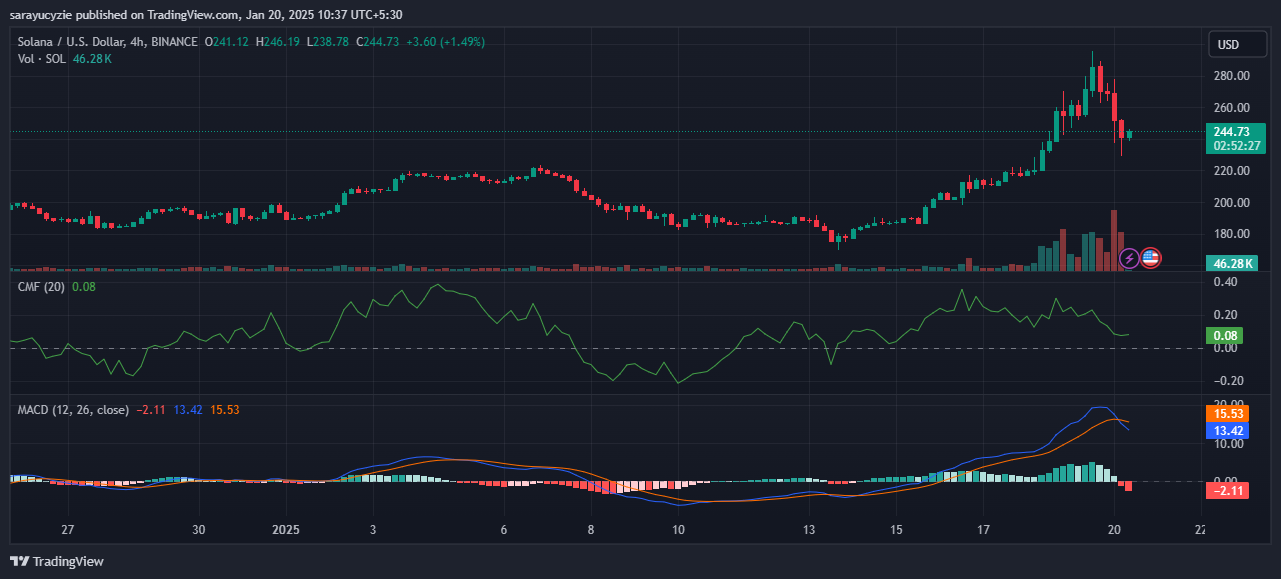
Solana's four-hour trading chart reveals a downside correction in progress. SOL currently trades 16.78% below its all-time high, with support at $240.63 being crucial. If bearish pressure persists, the altcoin may fall to $235, potentially extending losses even lower.
Solana 的四小時交易圖表顯示正在進行的下行修正。 SOL 目前的交易價格比歷史高點低 16.78%,240.63 美元的支撐至關重要。如果看跌壓力持續存在,山寨幣可能會跌至 235 美元,從而可能將損失進一步擴大。
Conversely, if momentum shifts, Solana could challenge the resistance level at $246.88, signaling a brief bullish outlook. Breaking above this mark could elevate the asset above $250, potentially bringing it closer to its all-time high.
相反,如果勢頭發生變化,Solana 可能會挑戰 246.88 美元的阻力位,表明前景短暫看漲。突破這一關卡可能會使該資產升至 250 美元以上,有可能使其更接近歷史高點。
Technical indicators for SOL suggest bearish momentum, with the Moving Average Convergence Divergence (MACD) line below the signal line, indicating a potential sell signal. However, the Chaikin Money Flow (CMF) remains positive at 0.08, suggesting moderate buying pressure.
SOL 的技術指標顯示看跌勢頭,移動平均收斂分歧 (MACD) 線低於訊號線,表明潛在的賣出訊號。然而,Chaikin 資金流量 (CMF) 仍為正值,為 0.08,顯示購買壓力適中。
Solana's daily relative strength index (RSI) is at 53.77, indicating a neutral position. Additionally, the daily frame shows the short-term 9-day moving average above the long-term 21-day moving average.
Solana 的每日相對強度指數 (RSI) 為 53.77,顯示為中性位置。此外,日線框架顯示短期 9 日移動平均線高於長期 21 日移動平均線。


 Cryptopolitan_News
 Optimisus
 DogeHome
 Optimisus
 Optimisus
 BlockchainReporter
 BlockchainReporter
 Optimisus


