Solana Surges to New Highs, Defies Market Downturn
솔라나(Solana), 시장 침체에도 불구하고 최고치 경신
Solana (SOL) has soared to a new all-time high of $294.33, defying the recent bearish trend in the cryptocurrency market. Despite a slight dip, SOL remains in the green, currently trading at around $243.
솔라나(SOL)는 최근 암호화폐 시장의 약세 추세를 무시하고 사상 최고치인 $294.33까지 치솟았습니다. 약간의 하락에도 불구하고 SOL은 현재 약 243달러에 거래되고 있는 녹색 상태를 유지하고 있습니다.
Despite its remarkable surge, SOL has not entirely escaped the market's pullback. Market analysts anticipate that it will soon approach the $400 mark. Currently, SOL boasts a market capitalization of approximately $118 billion.
눈에 띄는 급등에도 불구하고 SOL은 시장 하락세를 완전히 벗어나지 못했습니다. 시장 분석가들은 곧 400달러 선에 도달할 것으로 예상하고 있습니다. 현재 SOL의 시가총액은 약 1,180억 달러에 달합니다.
The altcoin began the day at $266.29, reaching its peak before experiencing a sharp decline to $231.63. Notably, it has faced liquidations worth $110.83 million over the past 24 hours, resulting in a daily trading volume of $35 billion.
알트코인은 하루 266.29달러로 시작하여 최고점에 도달한 후 231.63달러로 급락했습니다. 특히 지난 24시간 동안 1억1083만 달러 상당의 청산에 직면해 일일 거래량이 350억 달러에 달했다.
Over the past week, SOL has climbed over 34%, commencing at $183.24 and steadily ascending to its current level.
지난 주 동안 SOL은 34% 이상 상승하여 $183.24에서 시작하여 꾸준히 현재 수준으로 상승했습니다.
Technical Analysis: Bearish Correction Underway
기술적 분석: 약세 조정 진행 중
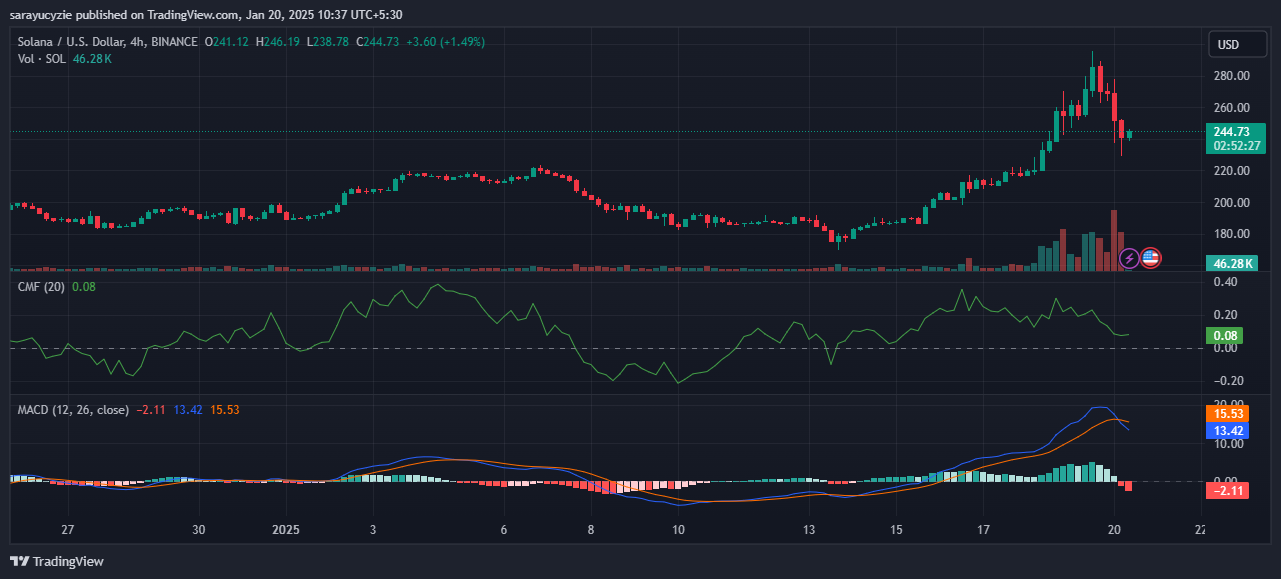
Solana's four-hour trading chart reveals a downside correction in progress. SOL currently trades 16.78% below its all-time high, with support at $240.63 being crucial. If bearish pressure persists, the altcoin may fall to $235, potentially extending losses even lower.
솔라나의 4시간 차트에는 하락 조정이 진행 중인 것으로 나타났습니다. SOL은 현재 사상 최고치보다 16.78% 낮은 가격에 거래되고 있으며, 240.63달러의 지지가 중요합니다. 약세 압력이 지속되면 알트코인은 235달러까지 하락할 수 있으며 잠재적으로 손실이 더욱 낮아질 수 있습니다.
Conversely, if momentum shifts, Solana could challenge the resistance level at $246.88, signaling a brief bullish outlook. Breaking above this mark could elevate the asset above $250, potentially bringing it closer to its all-time high.
반대로, 모멘텀이 바뀌면 솔라나는 $246.88의 저항 수준에 도전할 수 있으며 이는 잠시 강세 전망을 나타냅니다. 이 표시를 돌파하면 자산이 250달러 이상으로 상승하여 잠재적으로 사상 최고치에 가까워질 수 있습니다.
Technical indicators for SOL suggest bearish momentum, with the Moving Average Convergence Divergence (MACD) line below the signal line, indicating a potential sell signal. However, the Chaikin Money Flow (CMF) remains positive at 0.08, suggesting moderate buying pressure.
SOL의 기술적 지표는 약세 모멘텀을 시사하며, MACD(Moving Average Convergence Divergence) 선이 신호선 아래에 있어 잠재적인 매도 신호를 나타냅니다. 그러나 Chaikin Money Flow(CMF)는 0.08로 플러스를 유지하여 적당한 매수 압력을 시사합니다.
Solana's daily relative strength index (RSI) is at 53.77, indicating a neutral position. Additionally, the daily frame shows the short-term 9-day moving average above the long-term 21-day moving average.
솔라나의 일일 상대강도지수(RSI)는 53.77로 중립 포지션을 나타냅니다. 또한 일일 프레임에는 장기 21일 이동 평균보다 단기 9일 이동 평균이 표시됩니다.


 Optimisus
 Optimisus
 BlockchainReporter
 BlockchainReporter
 DogeHome
 Optimisus
 Optimisus
 Optimisus
 Thecryptoupdates


