Solana Surges to New Highs, Defies Market Downturn
ソラナは市場低迷をものともせず新高値に急上昇
Solana (SOL) has soared to a new all-time high of $294.33, defying the recent bearish trend in the cryptocurrency market. Despite a slight dip, SOL remains in the green, currently trading at around $243.
ソラナ(SOL)は、仮想通貨市場の最近の弱気傾向に反して、294.33ドルの史上最高値まで急騰しました。わずかな下落にもかかわらず、SOLは依然として緑色を維持しており、現在約243ドルで取引されています。
Despite its remarkable surge, SOL has not entirely escaped the market's pullback. Market analysts anticipate that it will soon approach the $400 mark. Currently, SOL boasts a market capitalization of approximately $118 billion.
目覚ましい急騰にもかかわらず、SOL は市場の反落から完全に逃れたわけではありません。市場アナリストは、まもなく400ドルの水準に近づくと予想している。現在、SOLの時価総額は約1180億ドルを誇る。
The altcoin began the day at $266.29, reaching its peak before experiencing a sharp decline to $231.63. Notably, it has faced liquidations worth $110.83 million over the past 24 hours, resulting in a daily trading volume of $35 billion.
アルトコインはその日266.29ドルで始まり、最高値に達した後、231.63ドルまで急落した。特に、過去24時間で1億1,083万ドル相当の清算に直面しており、その結果、1日の取引高は350億ドルに達しました。
Over the past week, SOL has climbed over 34%, commencing at $183.24 and steadily ascending to its current level.
過去 1 週間で、SOL は 34% 以上上昇し、183.24 ドルで始まり、現在のレベルまで着実に上昇しました。
Technical Analysis: Bearish Correction Underway
テクニカル分析:弱気調整が進行中
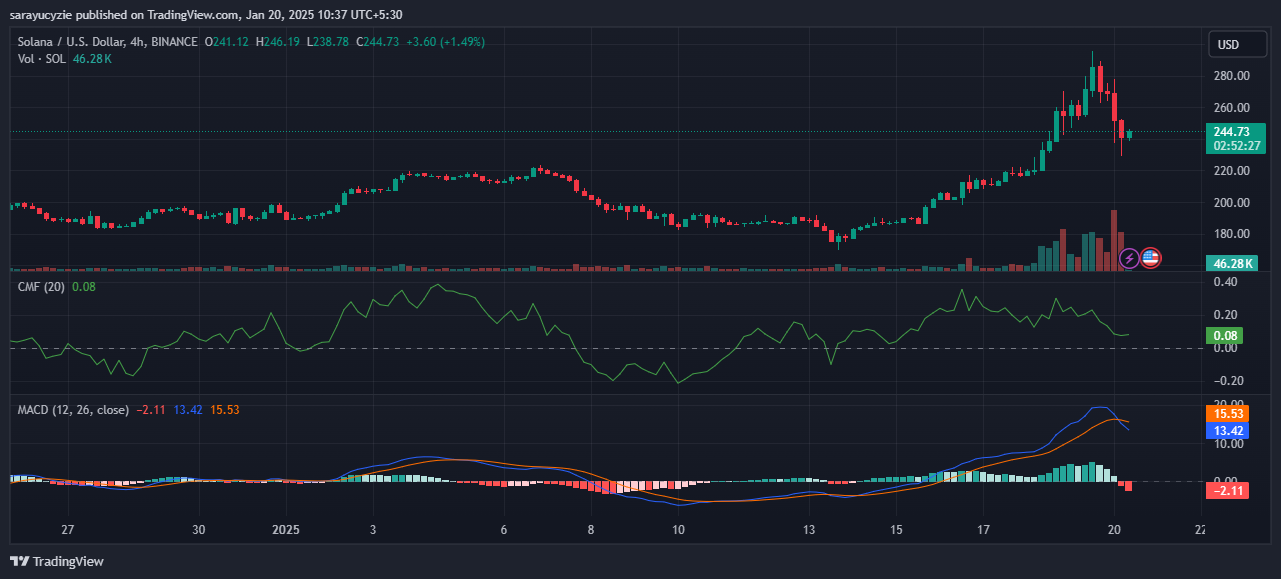
Solana's four-hour trading chart reveals a downside correction in progress. SOL currently trades 16.78% below its all-time high, with support at $240.63 being crucial. If bearish pressure persists, the altcoin may fall to $235, potentially extending losses even lower.
ソラナの4時間取引チャートは、下値修正が進行中であることを明らかにしている。 SOLは現在、過去最高値を16.78%下回る水準で取引されており、240.63ドルのサポートが重要となっている。弱気圧力が続けば、アルトコインは235ドルまで下落し、損失がさらに広がる可能性がある。
Conversely, if momentum shifts, Solana could challenge the resistance level at $246.88, signaling a brief bullish outlook. Breaking above this mark could elevate the asset above $250, potentially bringing it closer to its all-time high.
逆に、勢いが変化すれば、ソラナは246.88ドルの抵抗水準に挑戦し、一時的に強気の見通しを示す可能性があります。このマークを上回れば資産は250ドルを超え、史上最高値に近づく可能性がある。
Technical indicators for SOL suggest bearish momentum, with the Moving Average Convergence Divergence (MACD) line below the signal line, indicating a potential sell signal. However, the Chaikin Money Flow (CMF) remains positive at 0.08, suggesting moderate buying pressure.
SOL のテクニカル指標は弱気の勢いを示唆しており、移動平均収束ダイバージェンス (MACD) 線がシグナル線の下にあり、潜在的な売りシグナルを示しています。しかし、チャイキンマネーフロー(CMF)は0.08でプラスを維持しており、適度な買い圧力を示唆している。
Solana's daily relative strength index (RSI) is at 53.77, indicating a neutral position. Additionally, the daily frame shows the short-term 9-day moving average above the long-term 21-day moving average.
ソラナの日次相対強度指数 (RSI) は 53.77 で、中立の位置を示しています。さらに、日足フレームでは、短期の 9 日移動平均が長期の 21 日移動平均を上回っていることが示されています。


 Optimisus
 DogeHome
 Optimisus
 Optimisus
 BlockchainReporter
 BlockchainReporter
 Optimisus
 Optimisus


