Solana Surges Through Pivotal Range; Can It Reach $160 Following a 10% Jump?
Originally published on Coinpedia Fintech News
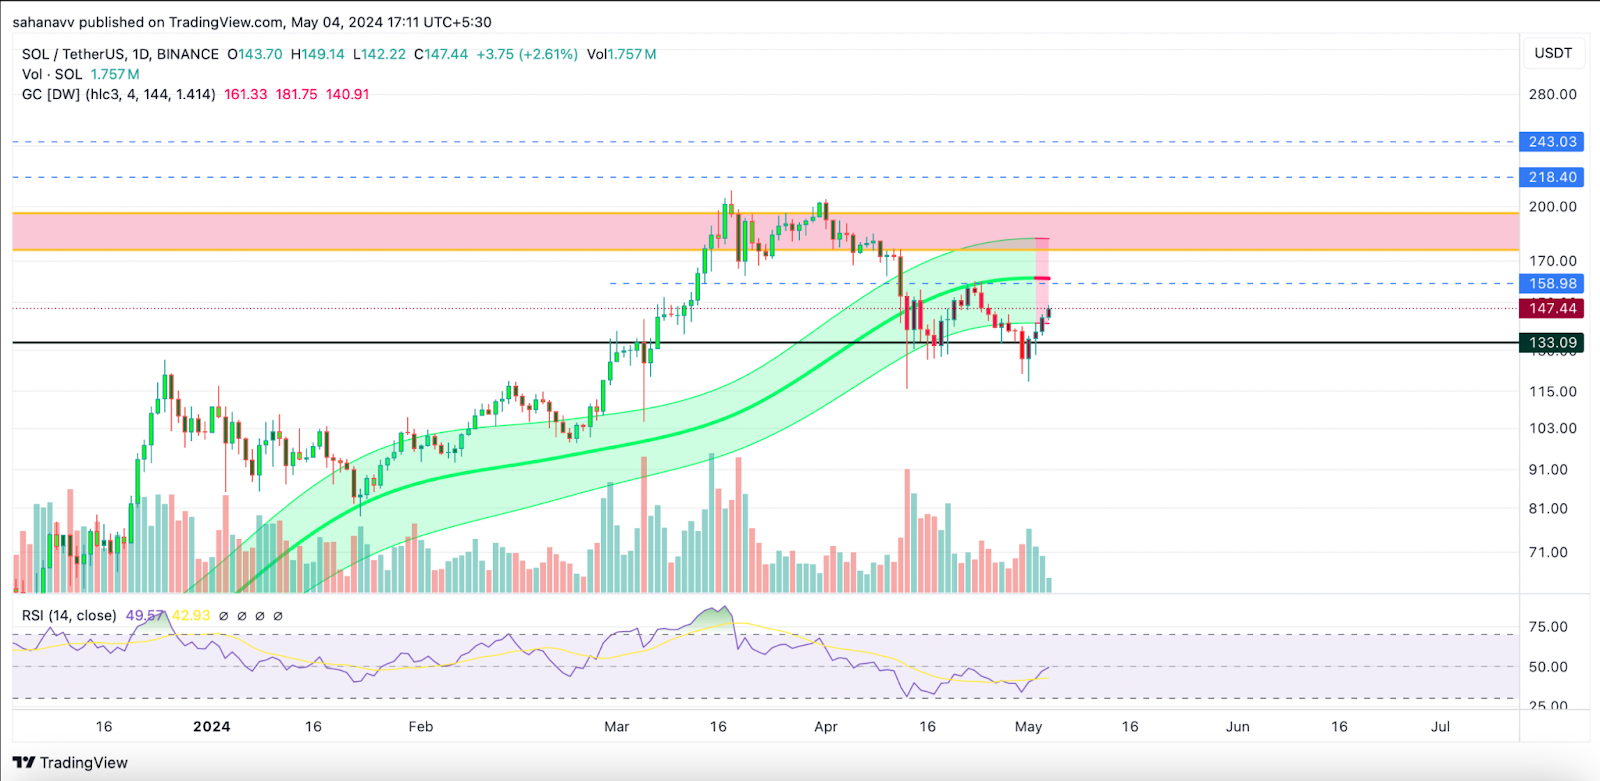
Since surpassing $100, Solana bulls have asserted dominance. However, the price failed to sustain above $200, forming a double top and plunging below $130. After a 40% drop, a strong rebound has emerged, suggesting a potential bullish pattern. A continued upswing of over 10% may initiate an ascending trend and a bull run if bulls maintain strength.
Solana's recent price action indicates increased buying power and reduced selling pressure. Technically, SOL remains in a downtrend, but the convergence of EMAs suggests potential corrections.
Will the Correction Continue or Will a Mid-Term Recovery Prevail?
The daily chart reveals a double bottom or 'W-shape' pattern, considered bullish. The rebound shows the price ascending towards the neckline at $158.98, potentially triggering a rise to the $175-$195 resistance zone. However, technical indicators suggest a brief consolidation.
The Gaussian channel has turned bearish, while the RSI rises, indicating a potential sideways consolidation. After accumulating strength, a rise to the interim resistance at $160 is possible. If bulls demonstrate strength, a surge to $200 may follow.


 DeFi Planet
 DogeHome
 BlockchainReporter
 Cointelegraph
 Thecryptoupdates
 Crypto Intelligence
 Crypto News Land
 Crypto Intelligence
 Optimisus


