Solana Surges Through Pivotal Range; Can It Reach $160 Following a 10% Jump?
ソラナが重要な範囲を急上昇。 10%の上昇で160ドルに到達できるでしょうか?
Originally published on Coinpedia Fintech News
元は Coinpedia Fintech News に掲載されました
Since surpassing $100, Solana bulls have asserted dominance. However, the price failed to sustain above $200, forming a double top and plunging below $130. After a 40% drop, a strong rebound has emerged, suggesting a potential bullish pattern. A continued upswing of over 10% may initiate an ascending trend and a bull run if bulls maintain strength.
100ドルを超えて以来、ソラナ強気派が優位性を主張している。しかし、価格は200ドルを超えて維持できず、ダブルトップを形成し、130ドルを下回った。 40% 下落した後、強い反発が現れ、強気のパターンの可能性を示唆しています。 10%を超える上昇が続くと、強気派が強さを維持すれば上昇傾向と強気相場が始まる可能性があります。
Solana's recent price action indicates increased buying power and reduced selling pressure. Technically, SOL remains in a downtrend, but the convergence of EMAs suggests potential corrections.
ソラナの最近の値動きは、購買力の増加と売り圧力の低下を示しています。テクニカル的には、SOL は引き続き下降傾向にありますが、EMA の収束は調整の可能性を示唆しています。
Will the Correction Continue or Will a Mid-Term Recovery Prevail?
調整は続くのか、それとも中期的な回復が進むのか?
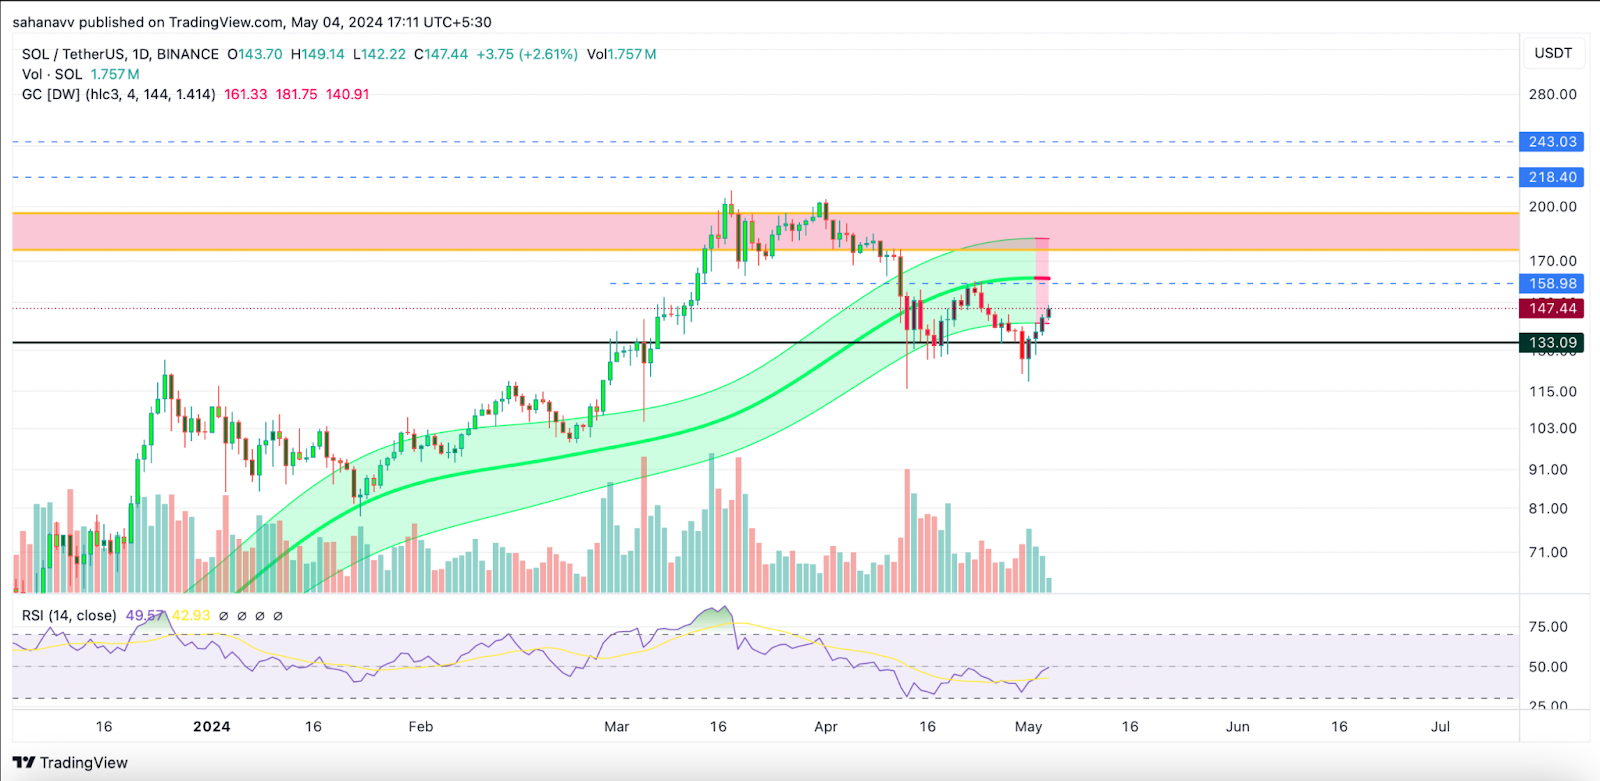
The daily chart reveals a double bottom or 'W-shape' pattern, considered bullish. The rebound shows the price ascending towards the neckline at $158.98, potentially triggering a rise to the $175-$195 resistance zone. However, technical indicators suggest a brief consolidation.
日足チャートでは、強気と考えられる二重底または「W 字型」パターンが見られます。反発は価格が158.98ドルのネックラインに向かって上昇していることを示しており、175ドルから195ドルのレジスタンスゾーンへの上昇を引き起こす可能性があります。ただし、テクニカル指標は短期間の値固めを示唆しています。
The Gaussian channel has turned bearish, while the RSI rises, indicating a potential sideways consolidation. After accumulating strength, a rise to the interim resistance at $160 is possible. If bulls demonstrate strength, a surge to $200 may follow.
ガウス チャネルは弱気になり、RSI は上昇し、横ばいの値固めの可能性を示しています。強さを蓄積した後、160ドルの暫定抵抗まで上昇する可能性があります。強気派が強さを示せば、その後200ドルまで上昇する可能性がある。


 TheCoinrise Media
 DogeHome
 Crypto Daily™
 Crypto Daily™
 TheCoinrise Media
 Thecoinrepublic.com
 TheCoinrise Media
 TheCoinrise Media


