Solana Surges Through Pivotal Range; Can It Reach $160 Following a 10% Jump?
Solana 飆升至關鍵區間;上漲 10% 後能否達到 160 美元?
Originally published on Coinpedia Fintech News
原文刊登於 Coinpedia 金融科技新聞
Since surpassing $100, Solana bulls have asserted dominance. However, the price failed to sustain above $200, forming a double top and plunging below $130. After a 40% drop, a strong rebound has emerged, suggesting a potential bullish pattern. A continued upswing of over 10% may initiate an ascending trend and a bull run if bulls maintain strength.
自突破 100 美元以來,Solana 多頭就佔據了主導地位。然而,價格未能維持在 200 美元上方,形成雙頂並跌破 130 美元。在下跌 40% 後,出現強勁反彈,暗示潛在的看漲模式。如果多頭保持強勢,持續超過 10% 的上漲可能會引發上升趨勢和多頭市場。
Solana's recent price action indicates increased buying power and reduced selling pressure. Technically, SOL remains in a downtrend, but the convergence of EMAs suggests potential corrections.
Solana 最近的價格走勢顯示購買力增強,銷售壓力減少。從技術上講,SOL 仍處於下降趨勢,但 EMA 的收斂表明存在潛在的修正。
Will the Correction Continue or Will a Mid-Term Recovery Prevail?
修正會持續還是會出現中期復甦?
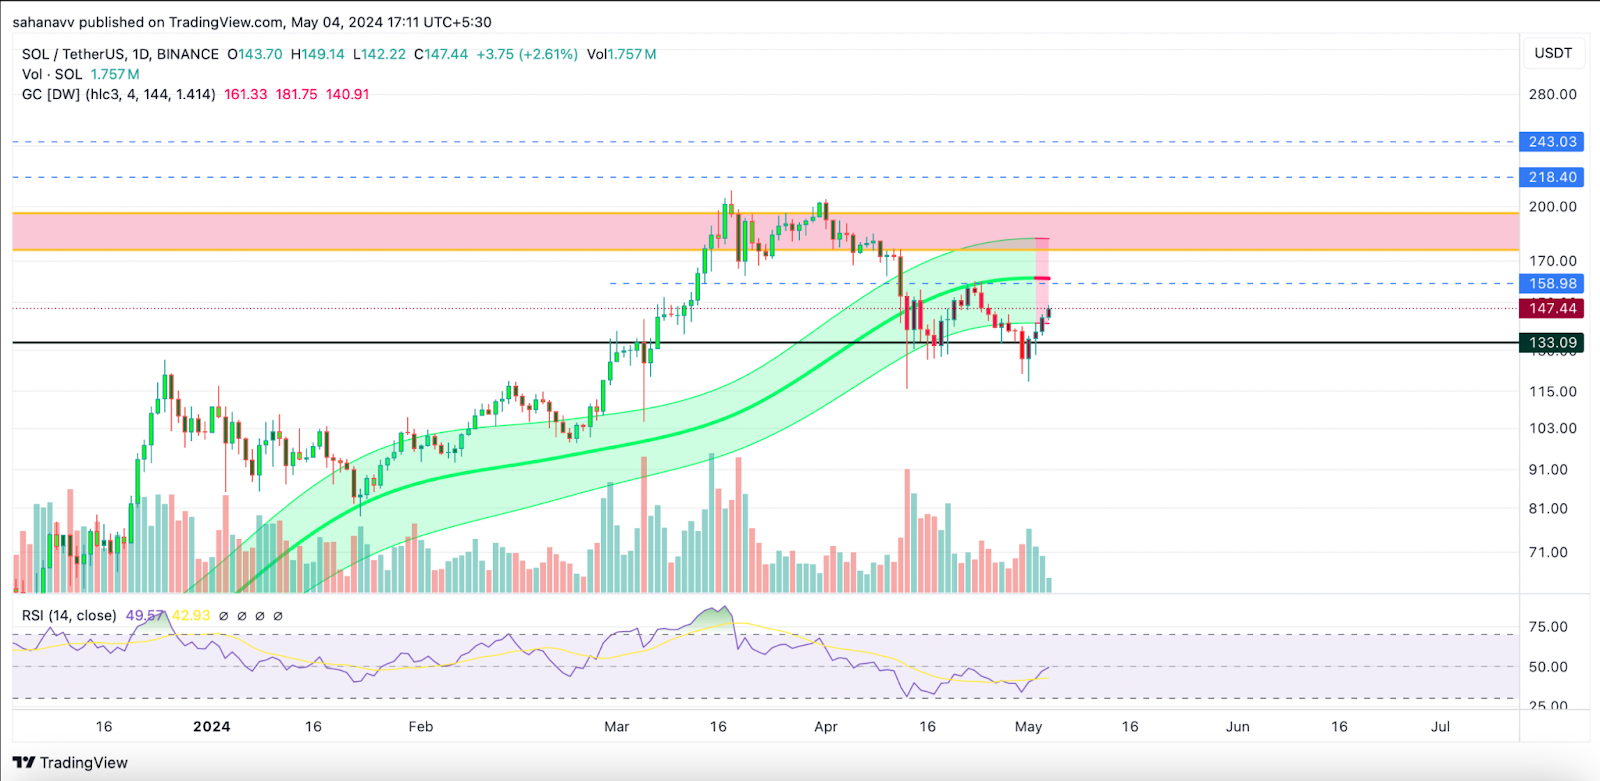
The daily chart reveals a double bottom or 'W-shape' pattern, considered bullish. The rebound shows the price ascending towards the neckline at $158.98, potentially triggering a rise to the $175-$195 resistance zone. However, technical indicators suggest a brief consolidation.
日線圖顯示雙底或「W 形」形態,被視為看漲。反彈顯示價格上漲至頸線 158.98 美元,可能引發上漲至 175-195 美元阻力區。然而,技術指標顯示短暫盤整。
The Gaussian channel has turned bearish, while the RSI rises, indicating a potential sideways consolidation. After accumulating strength, a rise to the interim resistance at $160 is possible. If bulls demonstrate strength, a surge to $200 may follow.
高斯通道已轉為看跌,而 RSI 則上升,表明潛在的橫向盤整。積聚力量後,有可能升至臨時阻力位 160 美元。如果多頭表現出力量,價格可能會飆升至 200 美元。


 Crypto Daily™
 Crypto Daily™
 DogeHome
 TheCoinrise Media
 Thecoinrepublic.com
 TheCoinrise Media
 TheCoinrise Media
 Cryptopolitan_News


