Solana Surges Through Pivotal Range; Can It Reach $160 Following a 10% Jump?
Solana는 중추 범위를 통해 급증합니다. 10% 상승하면 $160에 도달할 수 있습니까?
Originally published on Coinpedia Fintech News
원래 Coinpedia Fintech News에 게시되었습니다.
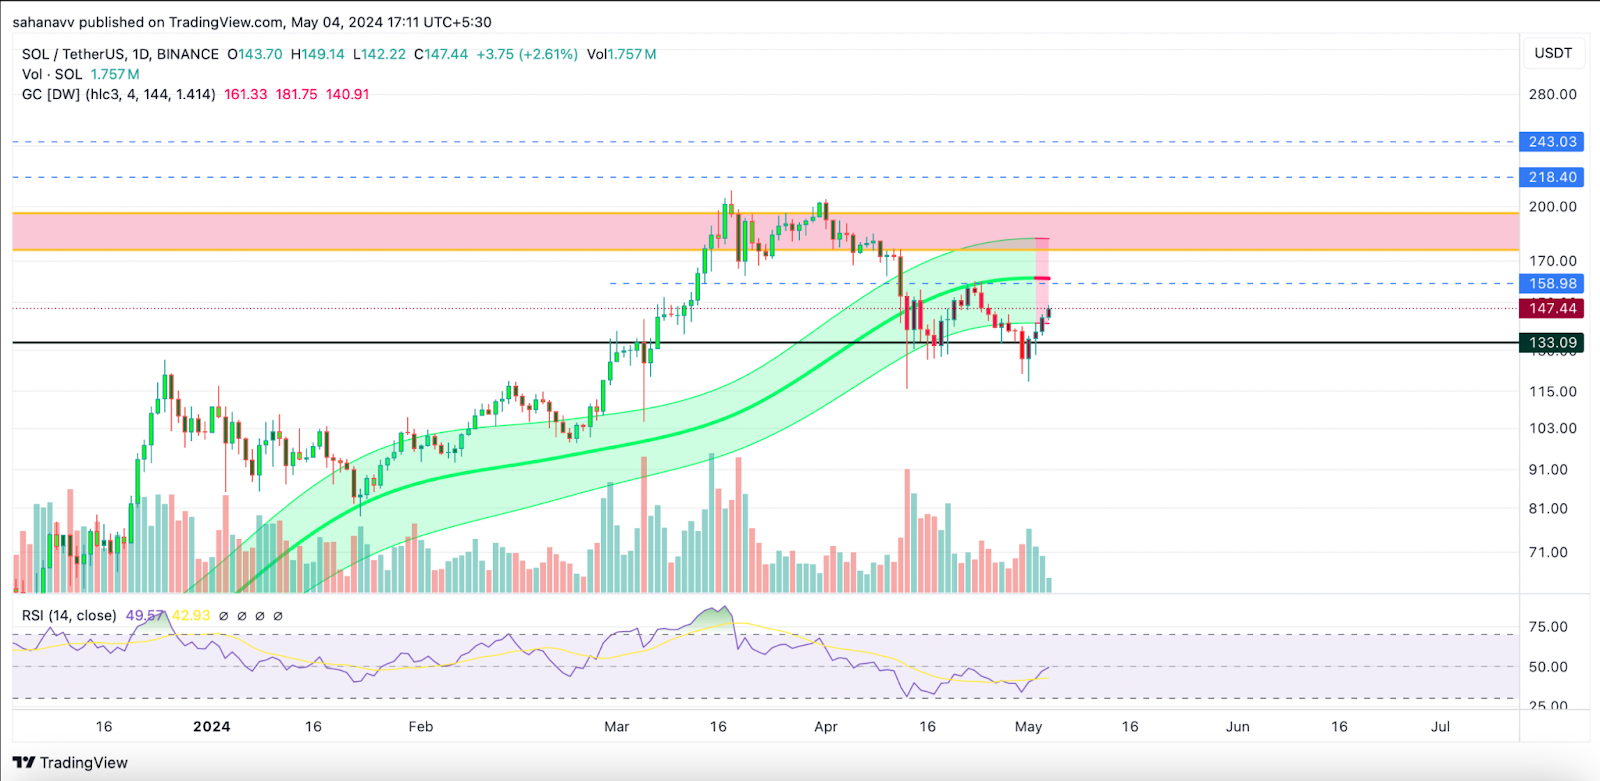
Since surpassing $100, Solana bulls have asserted dominance. However, the price failed to sustain above $200, forming a double top and plunging below $130. After a 40% drop, a strong rebound has emerged, suggesting a potential bullish pattern. A continued upswing of over 10% may initiate an ascending trend and a bull run if bulls maintain strength.
100달러를 돌파한 이후 솔라나 황소는 우위를 점했습니다. 그러나 가격은 200달러 이상을 유지하지 못하여 이중 천정을 형성하고 130달러 아래로 급락했습니다. 40% 하락 후 강력한 반등이 나타나 잠재적인 강세 패턴을 암시합니다. 10% 이상의 지속적인 상승세는 상승 추세를 시작하고 황소가 강세를 유지한다면 상승 추세를 시작할 수 있습니다.
Solana's recent price action indicates increased buying power and reduced selling pressure. Technically, SOL remains in a downtrend, but the convergence of EMAs suggests potential corrections.
솔라나의 최근 가격 조치는 구매력이 증가하고 판매 압력이 감소했음을 나타냅니다. 기술적으로 SOL은 여전히 하락 추세에 있지만 EMA의 수렴은 잠재적인 조정을 시사합니다.
Will the Correction Continue or Will a Mid-Term Recovery Prevail?
교정이 계속될 것인가, 아니면 중기 회복이 이루어질 것인가?
The daily chart reveals a double bottom or 'W-shape' pattern, considered bullish. The rebound shows the price ascending towards the neckline at $158.98, potentially triggering a rise to the $175-$195 resistance zone. However, technical indicators suggest a brief consolidation.
일일 차트에는 강세로 간주되는 이중 바닥 또는 'W자형' 패턴이 나타납니다. 반등은 가격이 $158.98의 네크라인을 향해 상승하고 있음을 보여 주며 잠재적으로 $175-$195 저항 영역까지 상승할 가능성이 있습니다. 그러나 기술적 지표는 간략한 통합을 시사합니다.
The Gaussian channel has turned bearish, while the RSI rises, indicating a potential sideways consolidation. After accumulating strength, a rise to the interim resistance at $160 is possible. If bulls demonstrate strength, a surge to $200 may follow.
가우스 채널은 약세로 변했고 RSI는 상승하여 잠재적인 횡보 횡보세를 나타냅니다. 힘이 축적된 후에는 임시 저항선인 160달러까지 상승할 수 있습니다. 황소가 강세를 보이면 200달러까지 급등할 수 있습니다.


 Crypto Daily™
 Crypto Daily™
 DogeHome
 TheCoinrise Media
 Thecoinrepublic.com
 TheCoinrise Media
 TheCoinrise Media
 Cryptopolitan_News


