

In the cryptocurrency market, technical analysis stands as a crucial indicator, particularly for investors trading in the futures market. What insights does technical analysis provide for Dogecoin, which at the time of writing is trading at $0.08103? We examine this through detailed chart analysis and by looking at key support and resistance levels.
Dogecoin Daily Chart Analysis
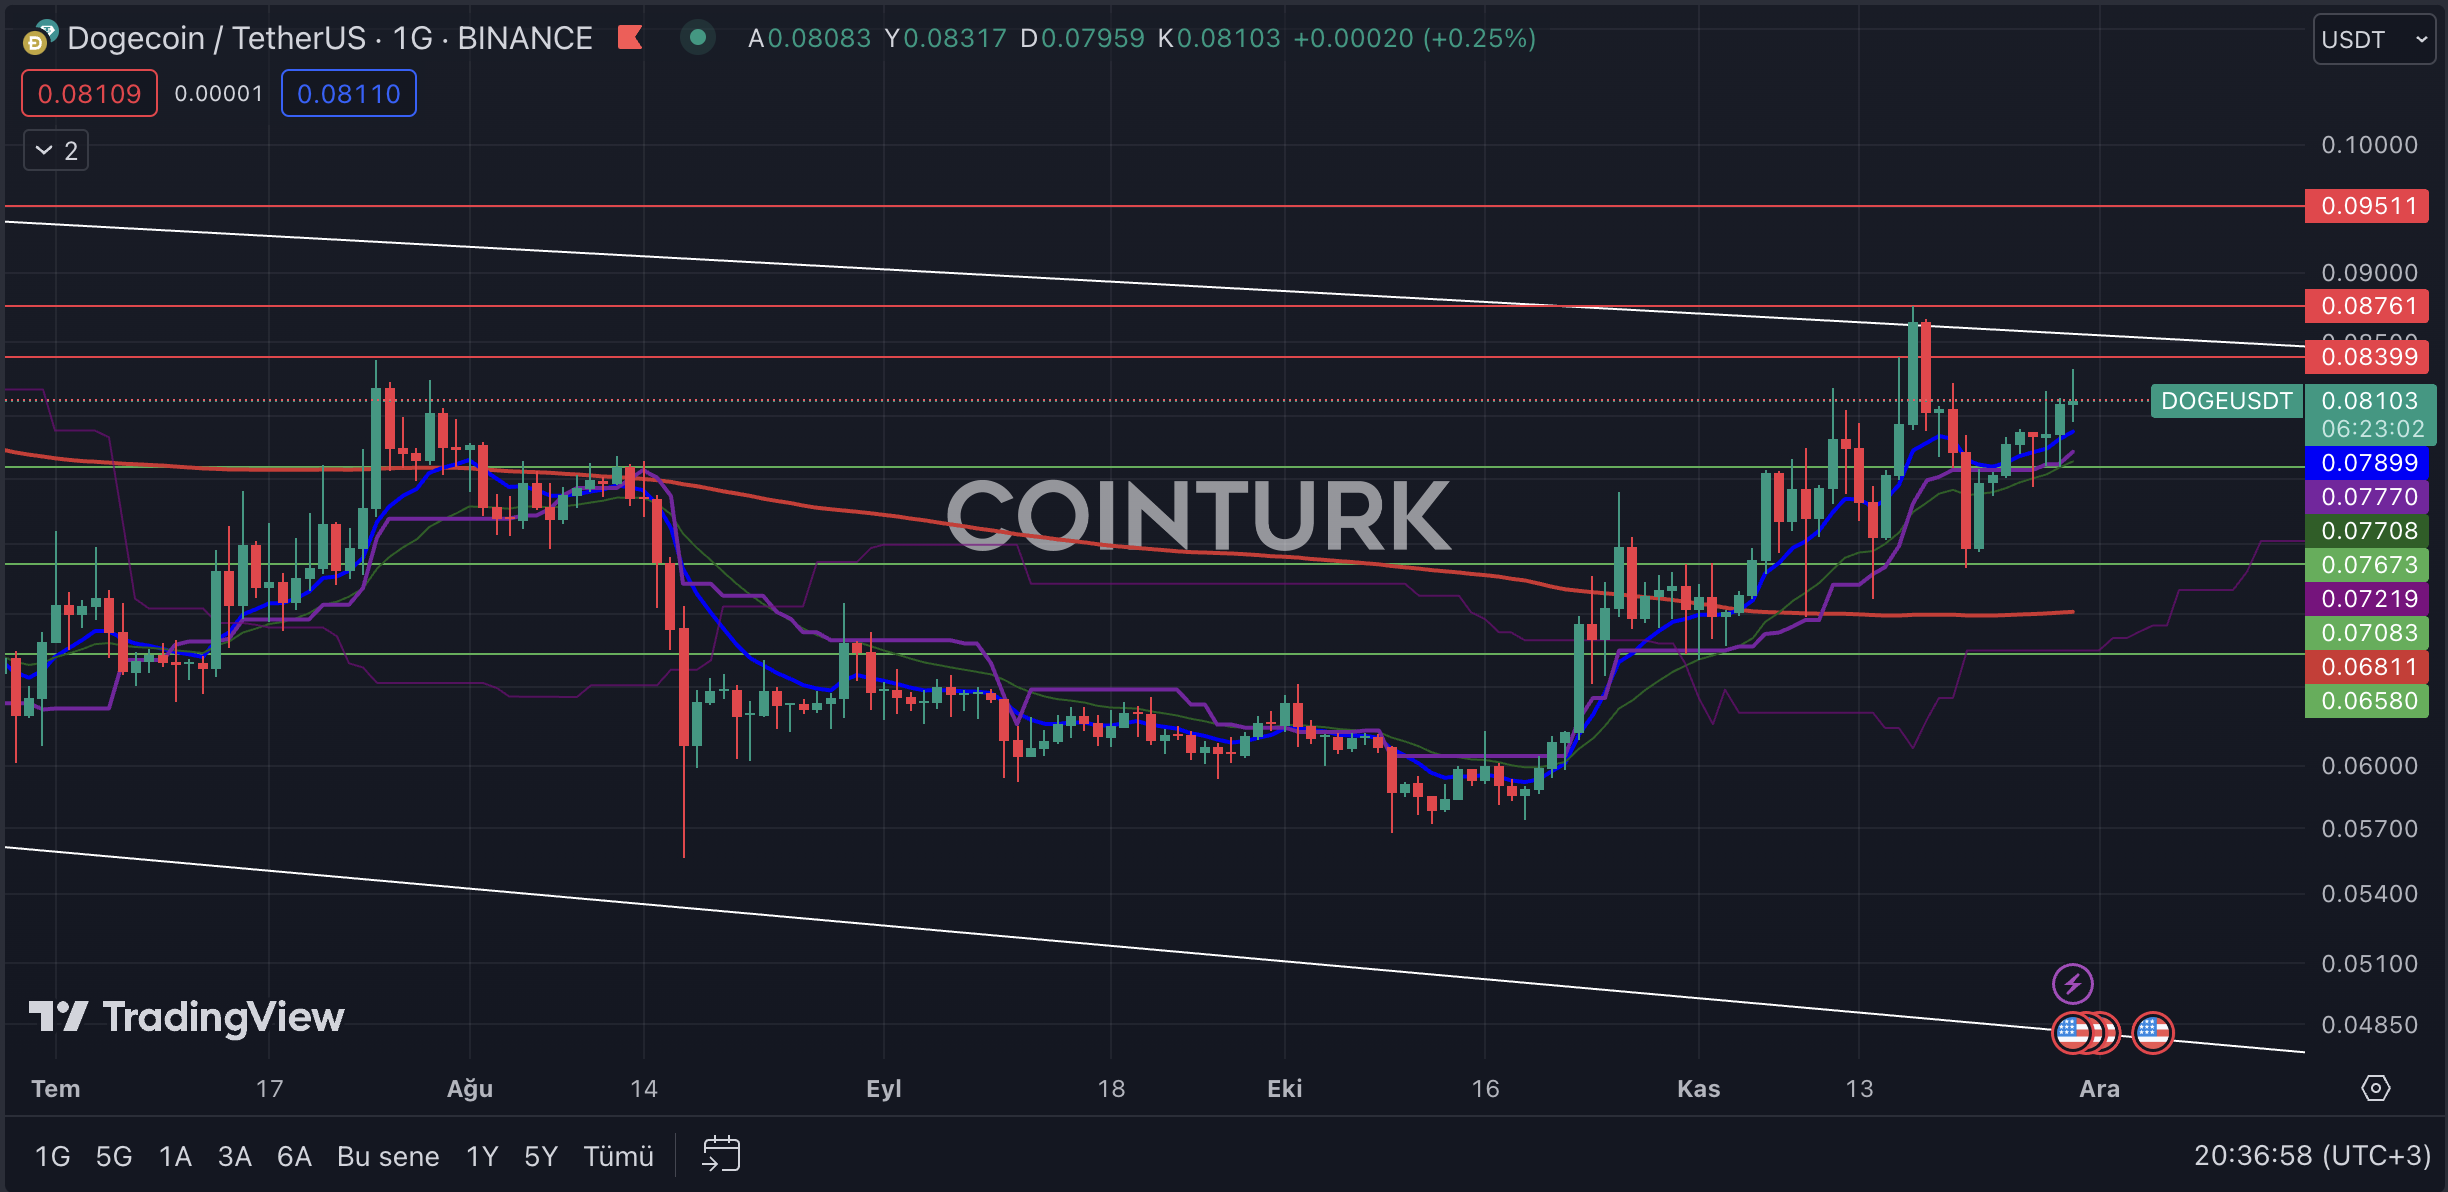
On Dogecoin’s daily chart, the first prominent pattern is a descending channel formation. After touching the resistance line on November 17th, DOGE encountered a significant hurdle and, following selling pressure, regained an upward momentum. The recent decrease in volatility during the last few bars could potentially slow down DOGE’s short-term pace.
The most critical support levels to monitor on DOGE’s daily chart are $0.07673, $0.07083, and $0.06580, respectively. A daily bar closing below the $0.06580 level would lead to DOGE trading below the EMA 200 (red line), which could signify a long-term loss in momentum.
The key resistance levels on DOGE’s daily chart are $0.08399, $0.08761, and $0.09511, respectively. A daily bar closing above the $0.08761 level would break the formation resistance and could lead to DOGE reaching its highest price in recent times.
Dogecoin Four-Hour Chart Analysis
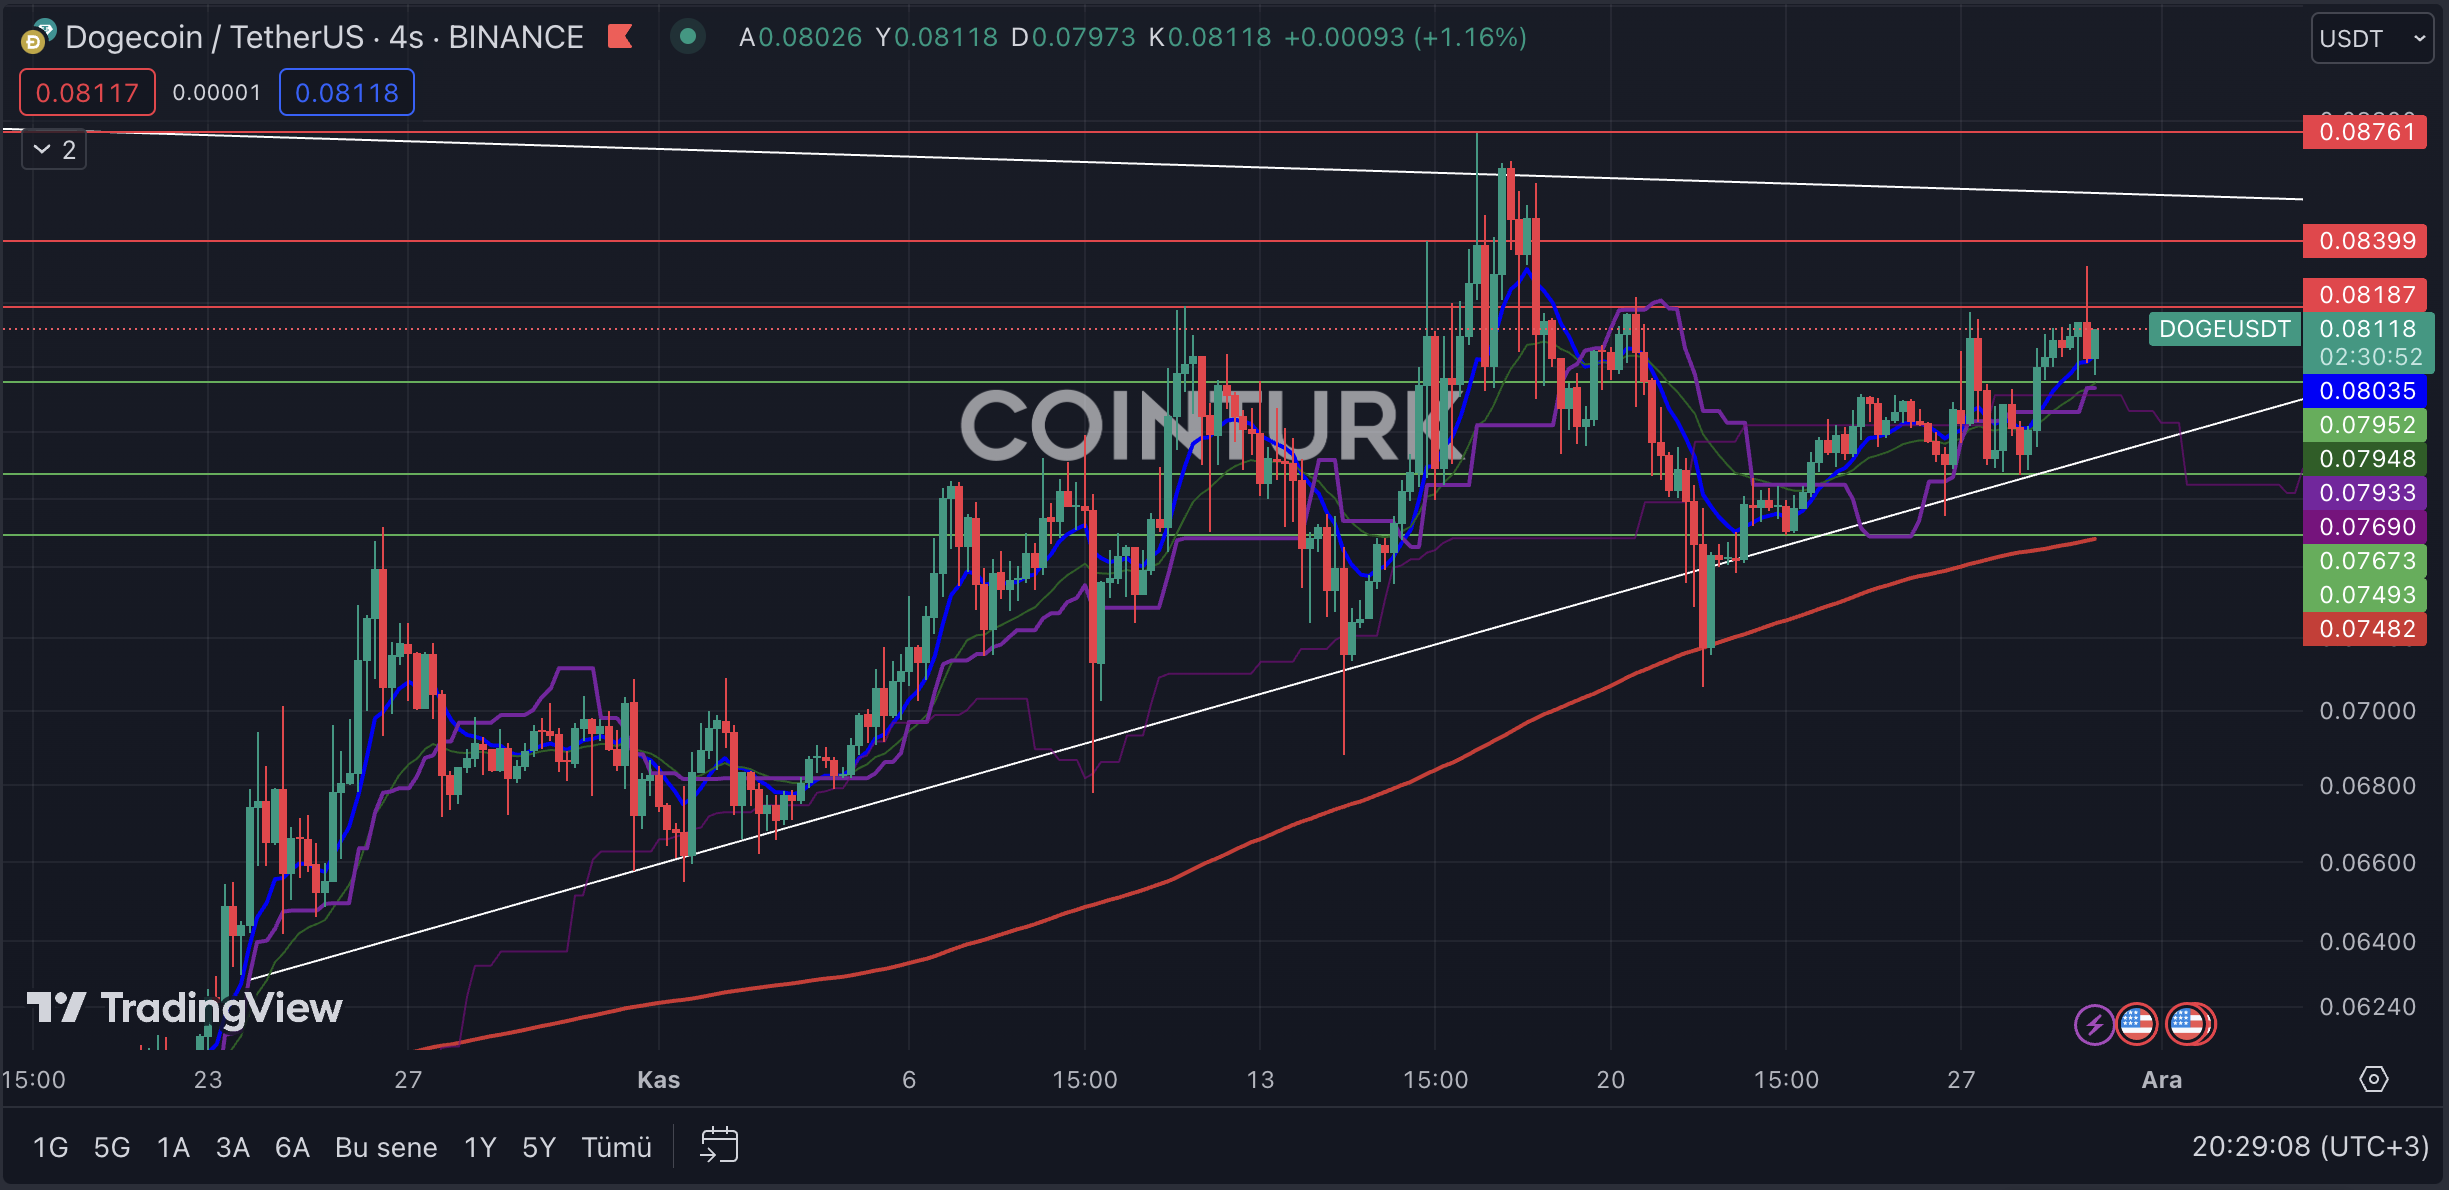
The first noticeable pattern in the four-hour Dogecoin chart is an inverse triangle formation. While traditionally seen as a negative scenario in traditional markets, a breakout of resistance could invalidate this outlook. Finding support at the EMA 200 level during a support breakdown could be a significant factor in an uptrend.
The most important support levels to follow on the four-hour chart for DOGE are $0.07952, $0.07673, and $0.07493, respectively. A bar closing below the $0.07673 level, which intersects with the support line, could lead to a long-term decline in DOGE’s momentum.
The critical resistance levels to watch on DOGE’s four-hour chart are $0.08187, $0.08399, and $0.08761, respectively. A bar closing above the $0.08761 level would signify a resistance breakout and could accelerate DOGE’s momentum.
- Technical analysis is vital for crypto investors.
- Support and resistance levels guide DOGE’s trajectory.
- Chart patterns suggest potential DOGE price movements.
 DeFi Planet
 Crypto Daily™
 BlockchainReporter
 TheCoinrise Media
 DogeHome
 Crypto Daily™
 Crypto Daily™
 TheCoinrise Media


