In the cryptocurrency market, technical analysis stands as a crucial indicator, particularly for investors trading in the futures market. What insights does technical analysis provide for Dogecoin, which at the time of writing is trading at $0.08103? We examine this through detailed chart analysis and by looking at key support and resistance levels.
암호화폐 시장에서 기술적 분석은 특히 선물 시장에서 거래하는 투자자에게 중요한 지표입니다. 이 글을 쓰는 시점에 0.08103달러에 거래되고 있는 Dogecoin에 대해 기술적 분석은 어떤 통찰력을 제공합니까? 우리는 상세한 차트 분석과 주요 지지 및 저항 수준을 살펴봄으로써 이를 조사합니다.
Dogecoin Daily Chart Analysis
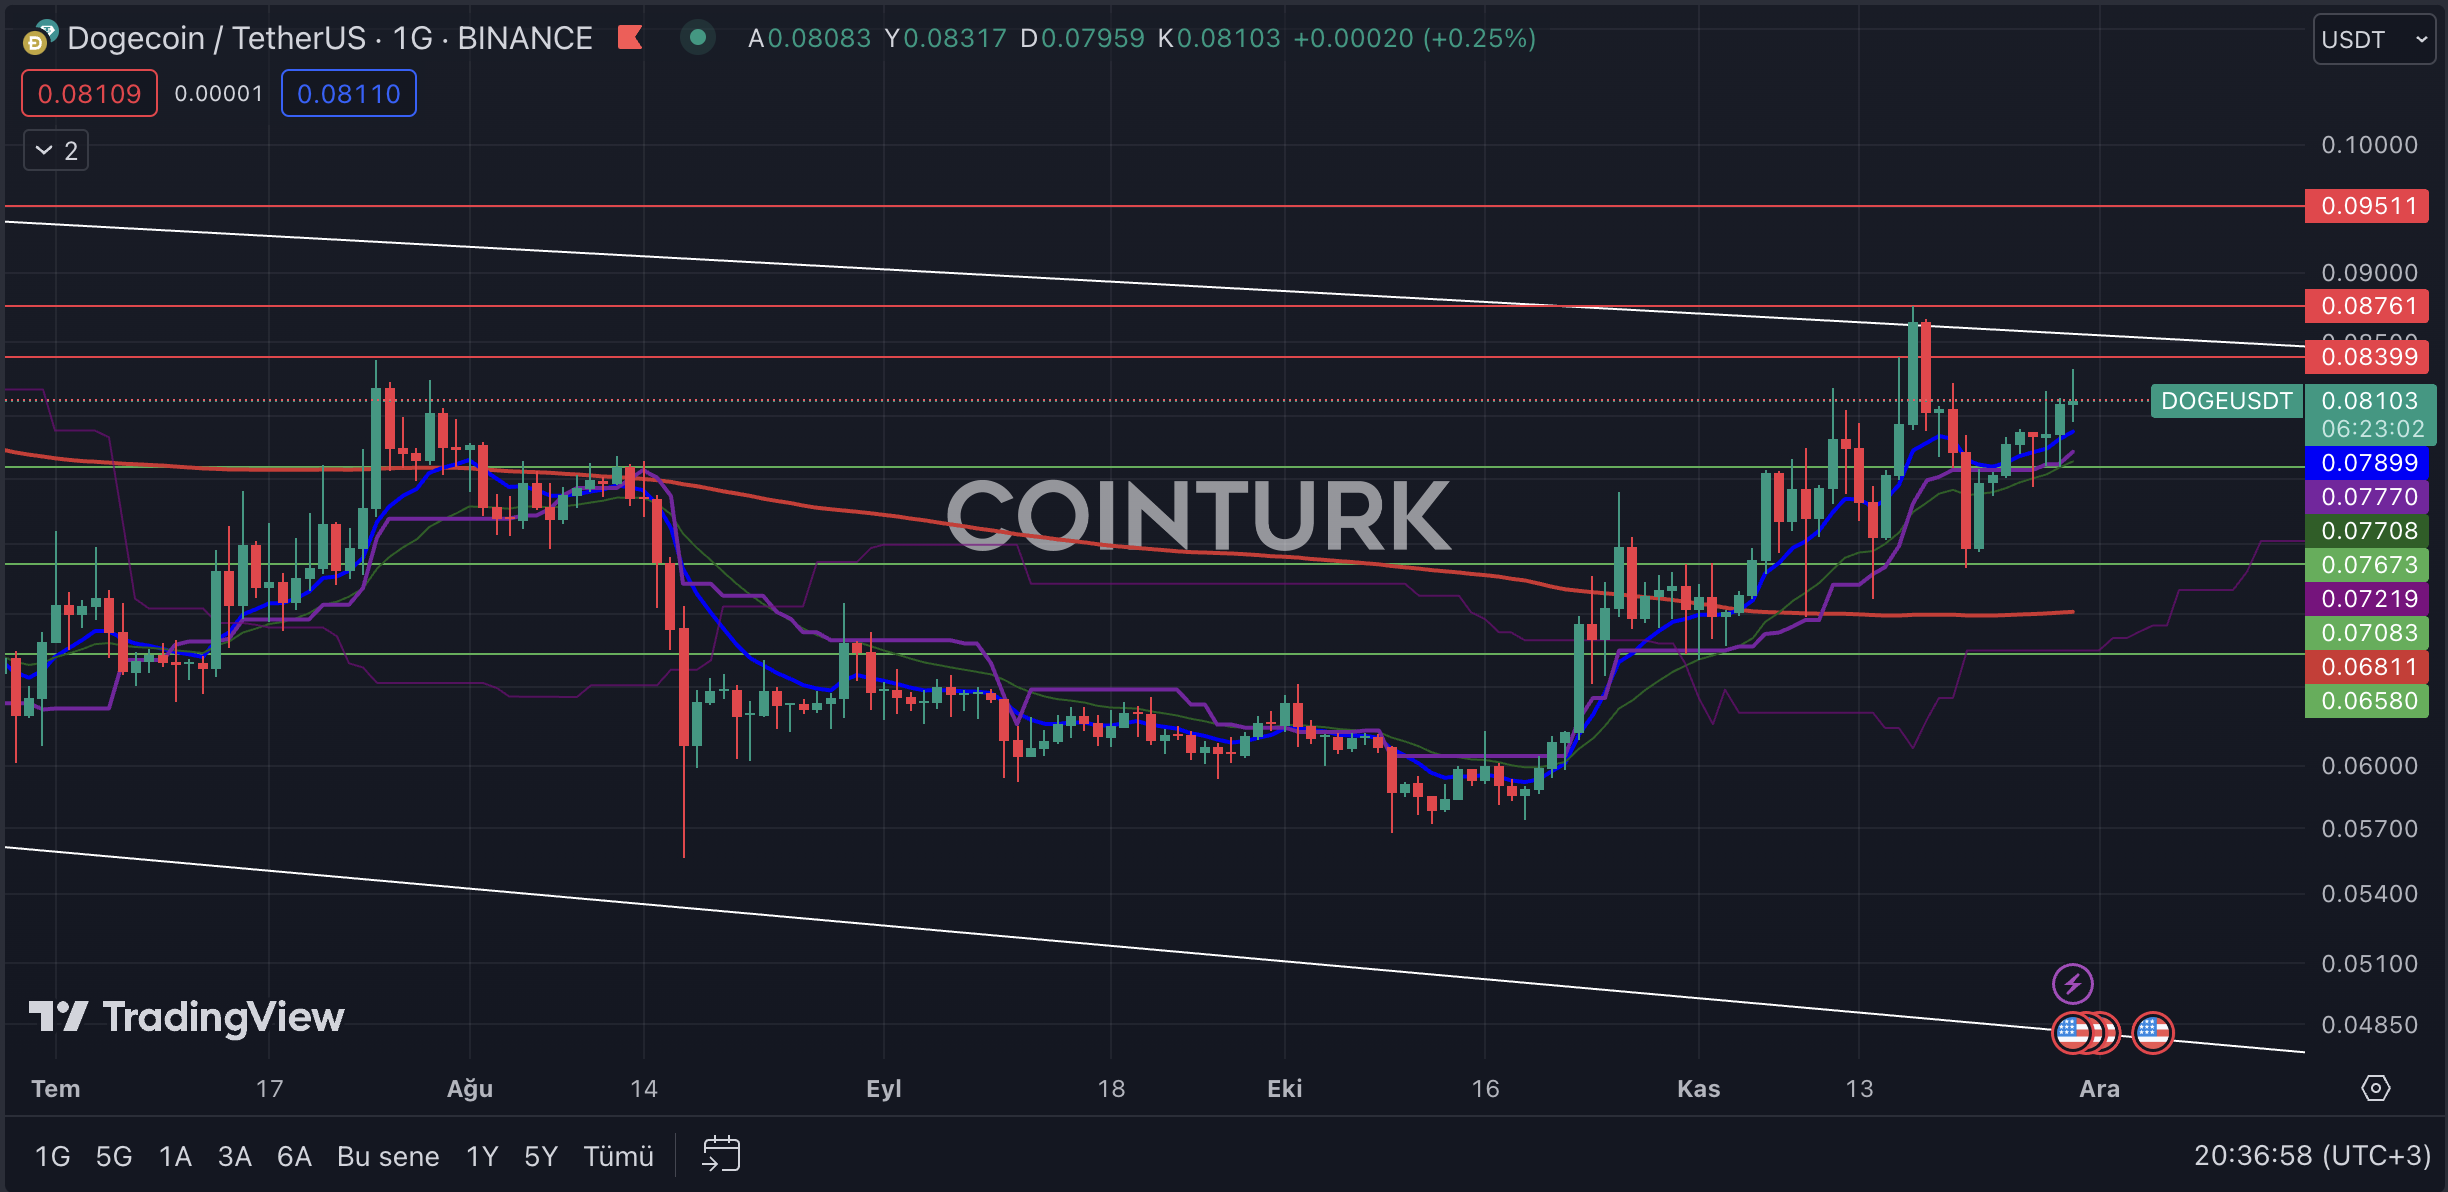
On Dogecoin’s daily chart, the first prominent pattern is a descending channel formation. After touching the resistance line on November 17th, DOGE encountered a significant hurdle and, following selling pressure, regained an upward momentum. The recent decrease in volatility during the last few bars could potentially slow down DOGE’s short-term pace.
The most critical support levels to monitor on DOGE’s daily chart are $0.07673, $0.07083, and $0.06580, respectively. A daily bar closing below the $0.06580 level would lead to DOGE trading below the EMA 200 (red line), which could signify a long-term loss in momentum.
DOGE의 일일 차트에서 모니터링해야 할 가장 중요한 지원 수준은 각각 $0.07673, $0.07083 및 $0.06580입니다. 일일 막대가 $0.06580 수준 아래로 마감되면 DOGE 거래가 EMA 200(빨간색 선) 아래로 이어질 수 있으며 이는 장기적인 모멘텀 손실을 의미할 수 있습니다.
The key resistance levels on DOGE’s daily chart are $0.08399, $0.08761, and $0.09511, respectively. A daily bar closing above the $0.08761 level would break the formation resistance and could lead to DOGE reaching its highest price in recent times.

Dogecoin Four-Hour Chart Analysis
Dogecoin 4시간 차트 분석
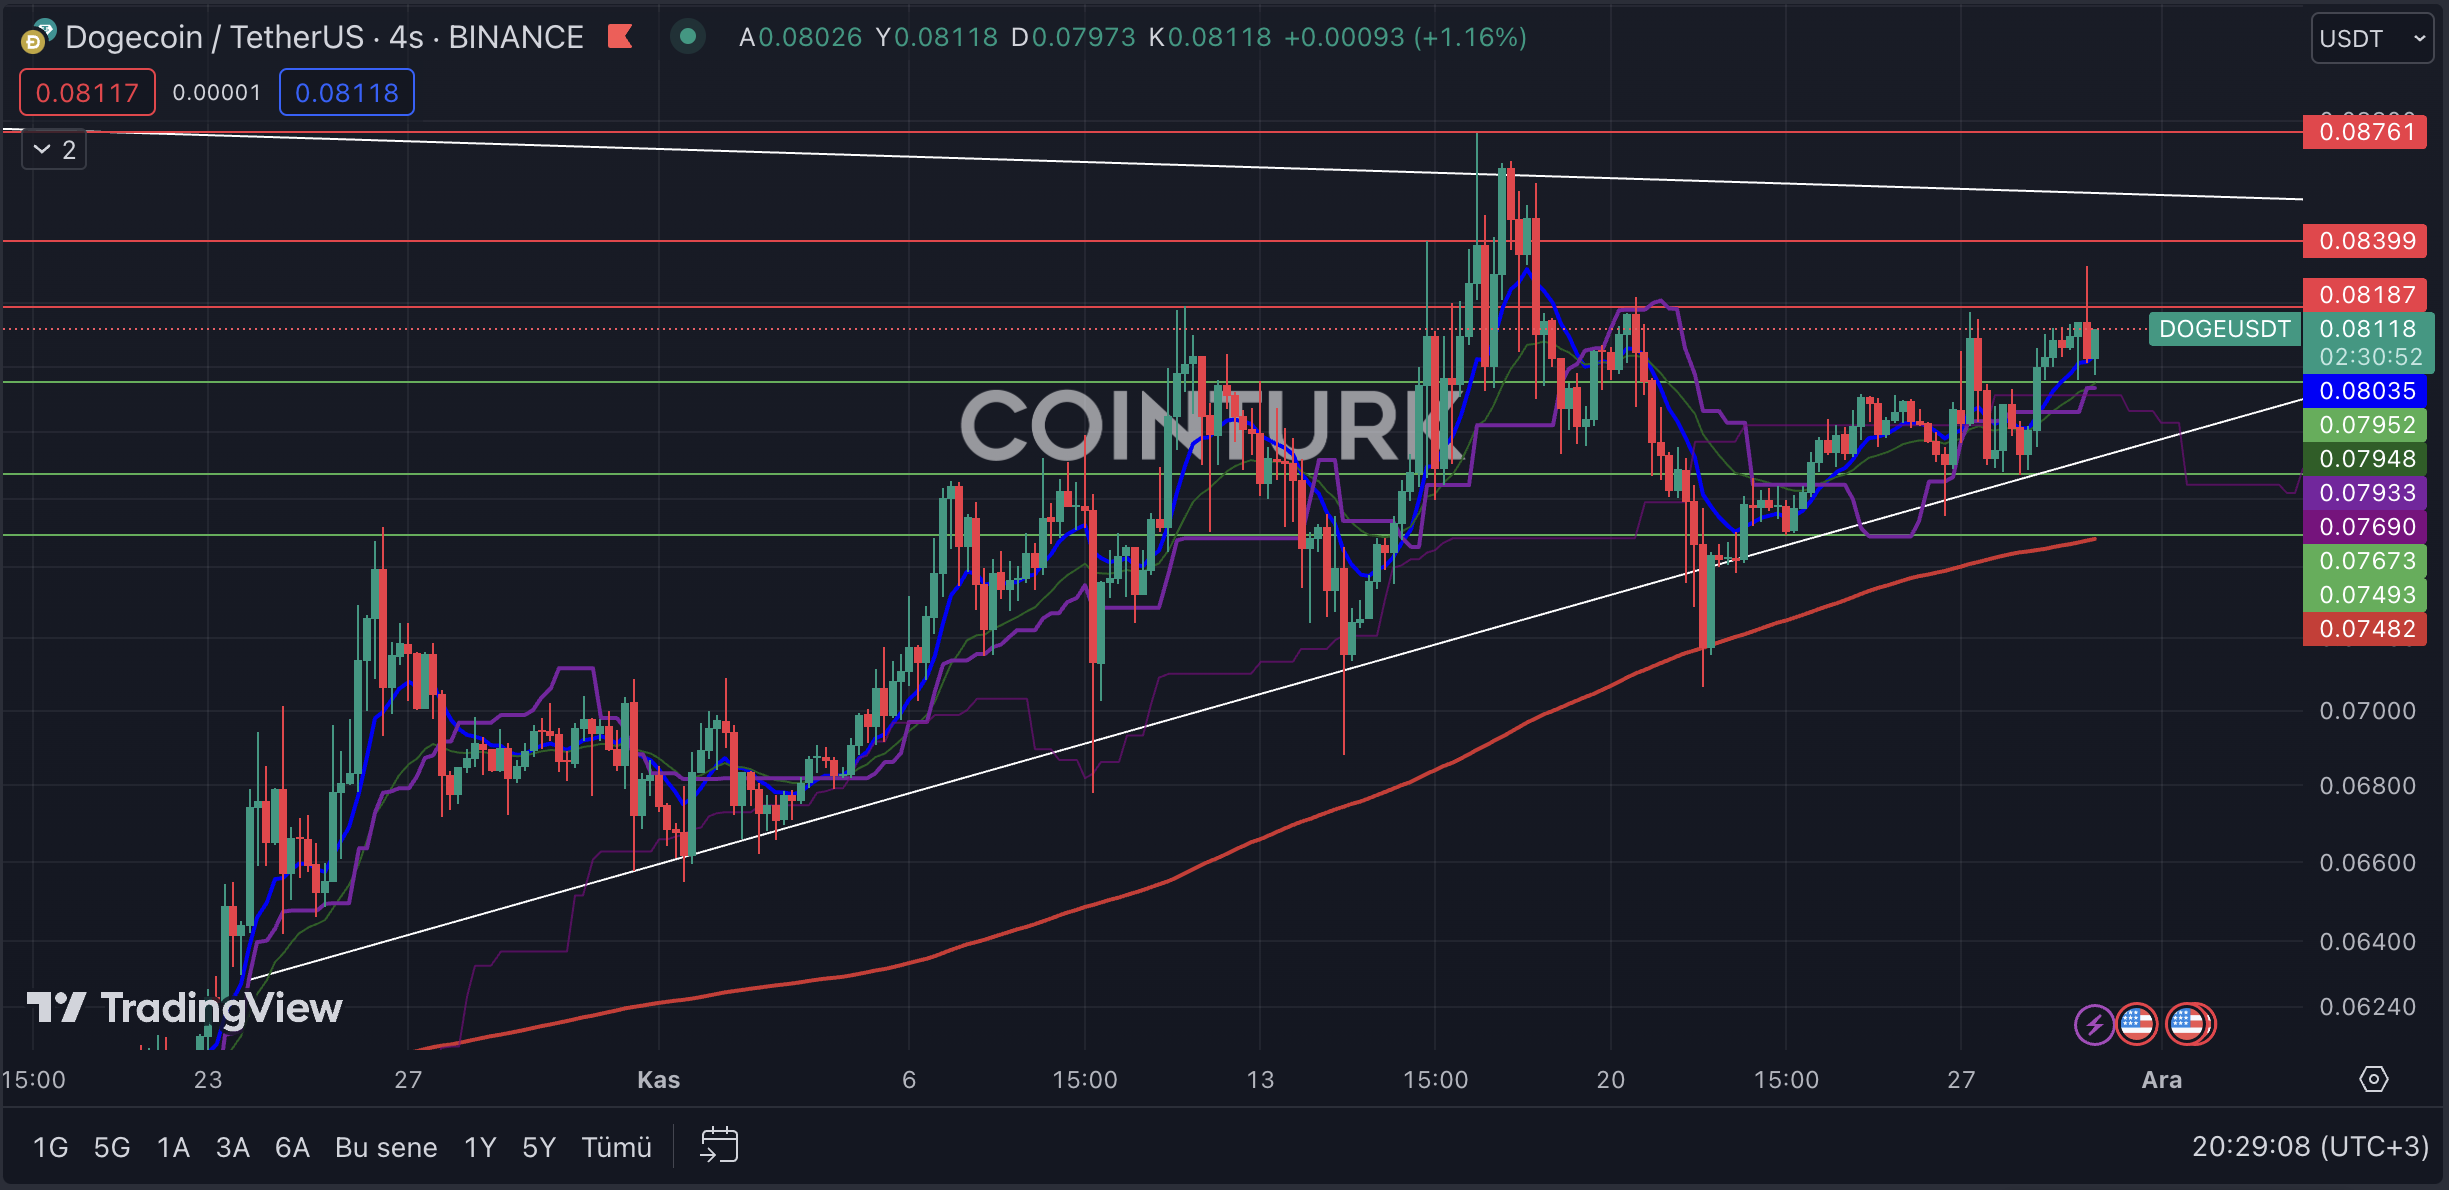
The first noticeable pattern in the four-hour Dogecoin chart is an inverse triangle formation. While traditionally seen as a negative scenario in traditional markets, a breakout of resistance could invalidate this outlook. Finding support at the EMA 200 level during a support breakdown could be a significant factor in an uptrend.
The most important support levels to follow on the four-hour chart for DOGE are $0.07952, $0.07673, and $0.07493, respectively. A bar closing below the $0.07673 level, which intersects with the support line, could lead to a long-term decline in DOGE’s momentum.
DOGE의 4시간 차트에서 따라야 할 가장 중요한 지원 수준은 각각 $0.07952, $0.07673 및 $0.07493입니다. 지지선과 교차하는 $0.07673 수준 아래로 봉이 마감되면 DOGE의 모멘텀이 장기적으로 하락할 수 있습니다.
The critical resistance levels to watch on DOGE’s four-hour chart are $0.08187, $0.08399, and $0.08761, respectively. A bar closing above the $0.08761 level would signify a resistance breakout and could accelerate DOGE’s momentum.
DOGE의 4시간 차트에서 주목해야 할 중요한 저항 수준은 각각 $0.08187, $0.08399, $0.08761입니다. $0.08761 수준 위에서 마감되는 막대는 저항 돌파를 의미하며 DOGE의 모멘텀을 가속화할 수 있습니다.

- Technical analysis is vital for crypto investors.
- Support and resistance levels guide DOGE’s trajectory.
- Chart patterns suggest potential DOGE price movements.
계속 읽기: https://en.coin-turk.com/unraveling-dogecoins-future-a-technical-analytic-of-market-trajectories/


 DeFi Planet
 Crypto Daily™
 BlockchainReporter
 TheCoinrise Media
 DogeHome
 Crypto Daily™
 Crypto Daily™
 TheCoinrise Media


