

In the cryptocurrency market, technical analysis stands as a crucial indicator, particularly for investors trading in the futures market. What insights does technical analysis provide for Dogecoin, which at the time of writing is trading at $0.08103? We examine this through detailed chart analysis and by looking at key support and resistance levels.
在加密货币市场中,技术分析是一个至关重要的指标,特别是对于在期货市场交易的投资者而言。在撰写本文时,狗狗币的交易价格为 0.08103 美元,技术分析为狗狗币提供了哪些见解?我们通过详细的图表分析以及关键支撑位和阻力位来检验这一点。
Dogecoin Daily Chart Analysis
狗狗币每日图表分析
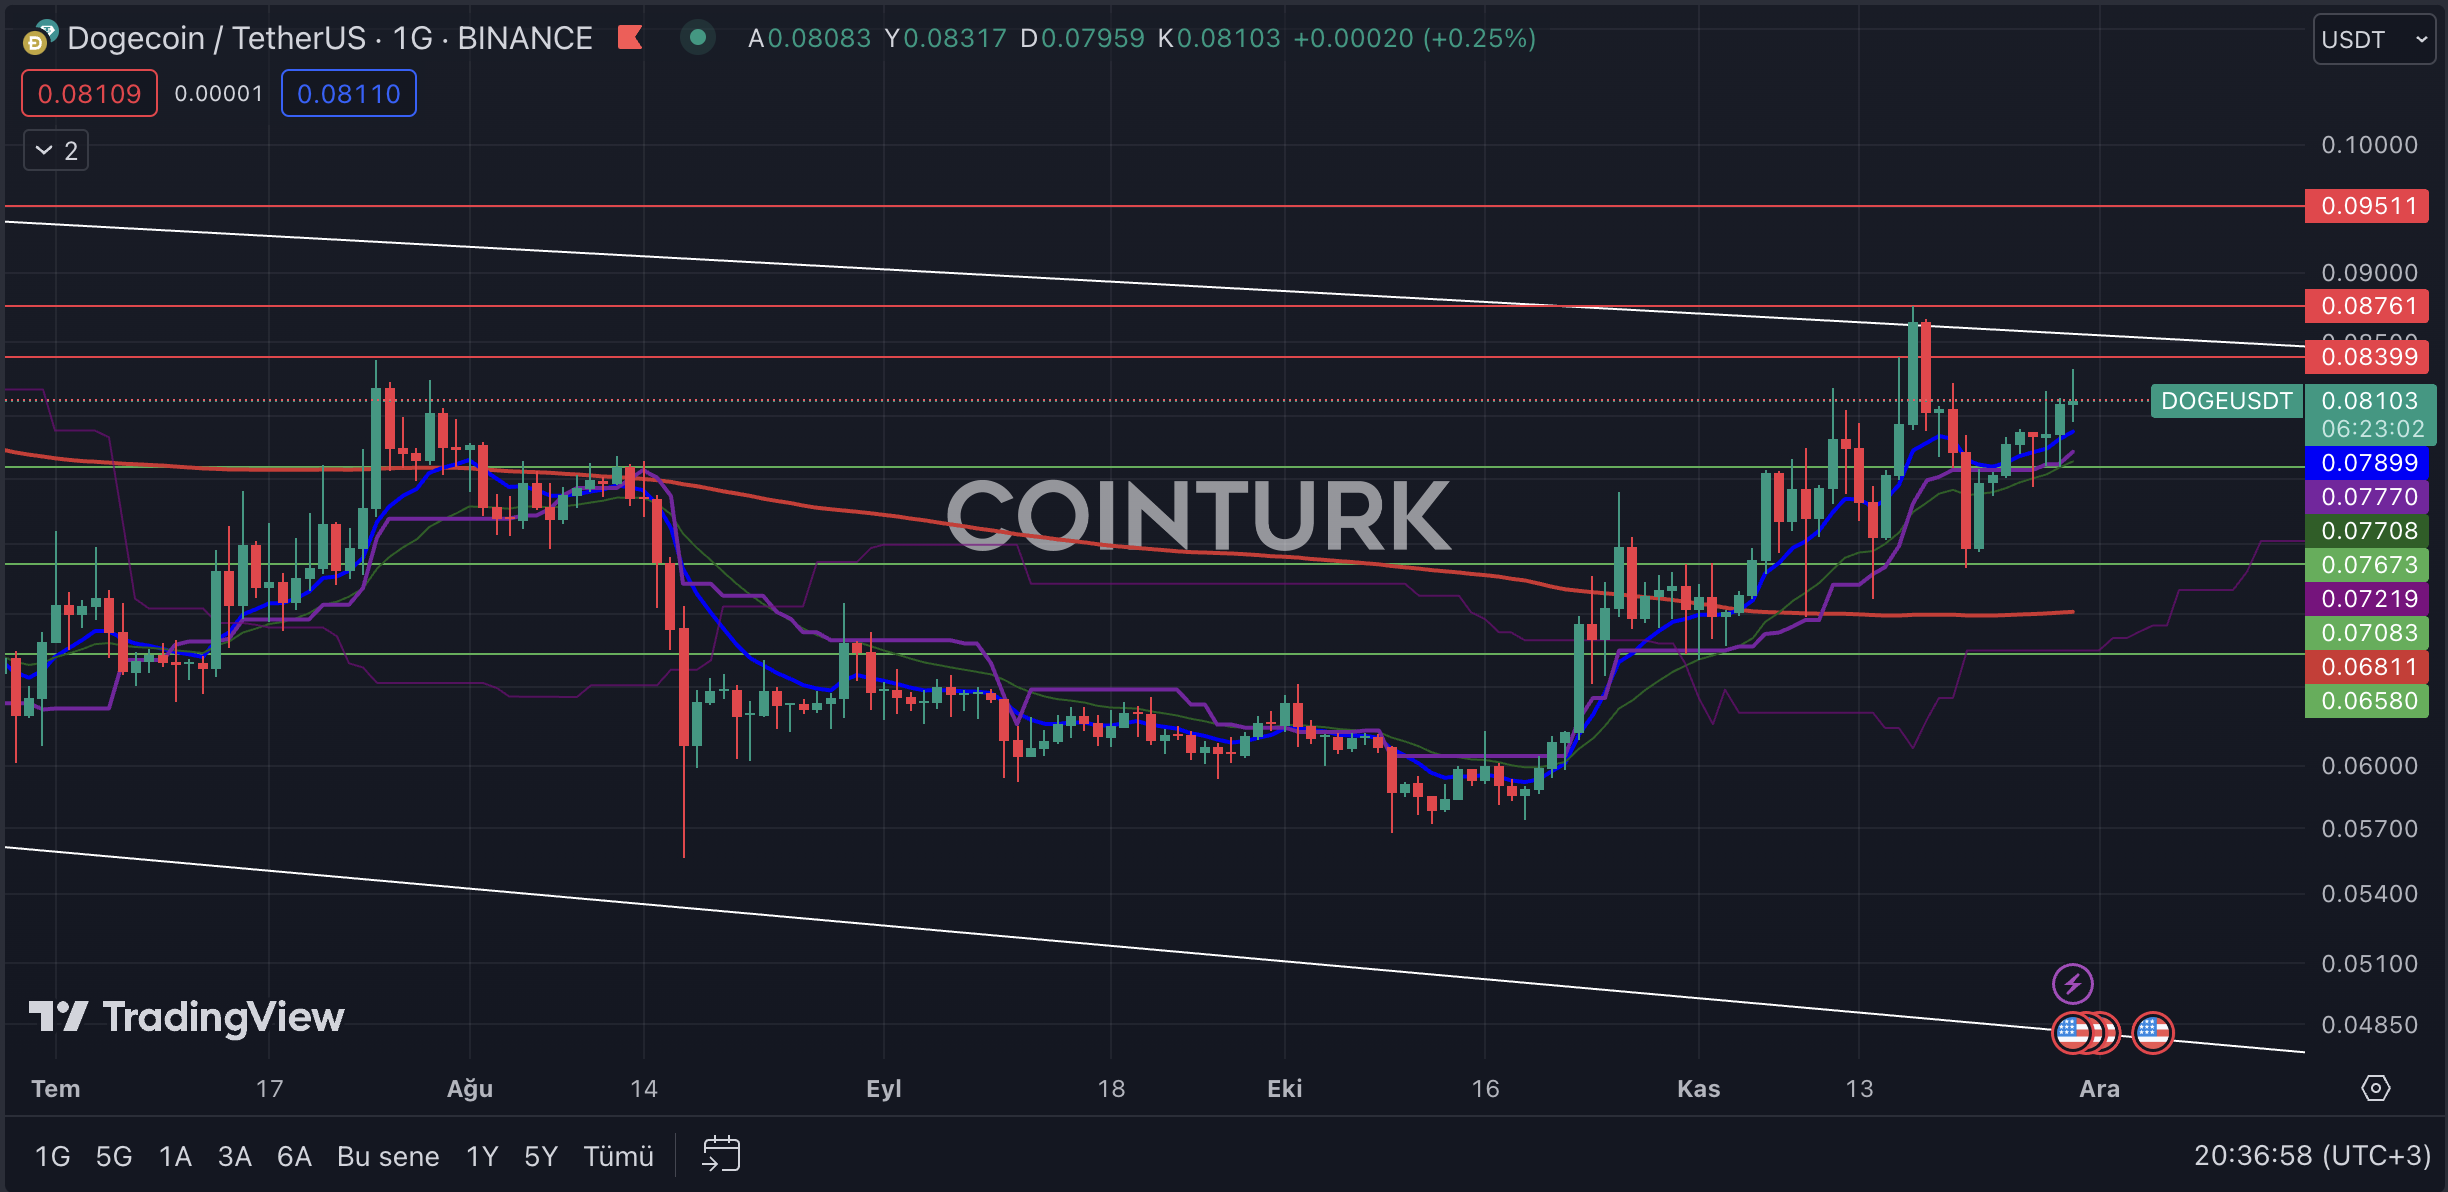
On Dogecoin’s daily chart, the first prominent pattern is a descending channel formation. After touching the resistance line on November 17th, DOGE encountered a significant hurdle and, following selling pressure, regained an upward momentum. The recent decrease in volatility during the last few bars could potentially slow down DOGE’s short-term pace.
在狗狗币的日线图上,第一个突出的模式是下降通道形成。 11 月 17 日触及阻力线后,DOGE 遇到了重大障碍,并在抛售压力下重新获得了上涨动力。最近最后几根柱线波动性的下降可能会减缓 DOGE 的短期步伐。
The most critical support levels to monitor on DOGE’s daily chart are $0.07673, $0.07083, and $0.06580, respectively. A daily bar closing below the $0.06580 level would lead to DOGE trading below the EMA 200 (red line), which could signify a long-term loss in momentum.
DOGE 日线图上需要监控的最关键支撑位分别为 0.07673 美元、0.07083 美元和 0.06580 美元。日线收盘价低于 0.06580 美元水平将导致 DOGE 交易低于 EMA 200(红线),这可能意味着长期动能损失。
The key resistance levels on DOGE’s daily chart are $0.08399, $0.08761, and $0.09511, respectively. A daily bar closing above the $0.08761 level would break the formation resistance and could lead to DOGE reaching its highest price in recent times.
DOGE 日线图上的关键阻力位分别为 0.08399 美元、0.08761 美元和 0.09511 美元。日线收盘价高于 0.08761 美元水平将突破形成阻力,并可能导致 DOGE 达到近期最高价格。
Dogecoin Four-Hour Chart Analysis
狗狗币四小时图分析
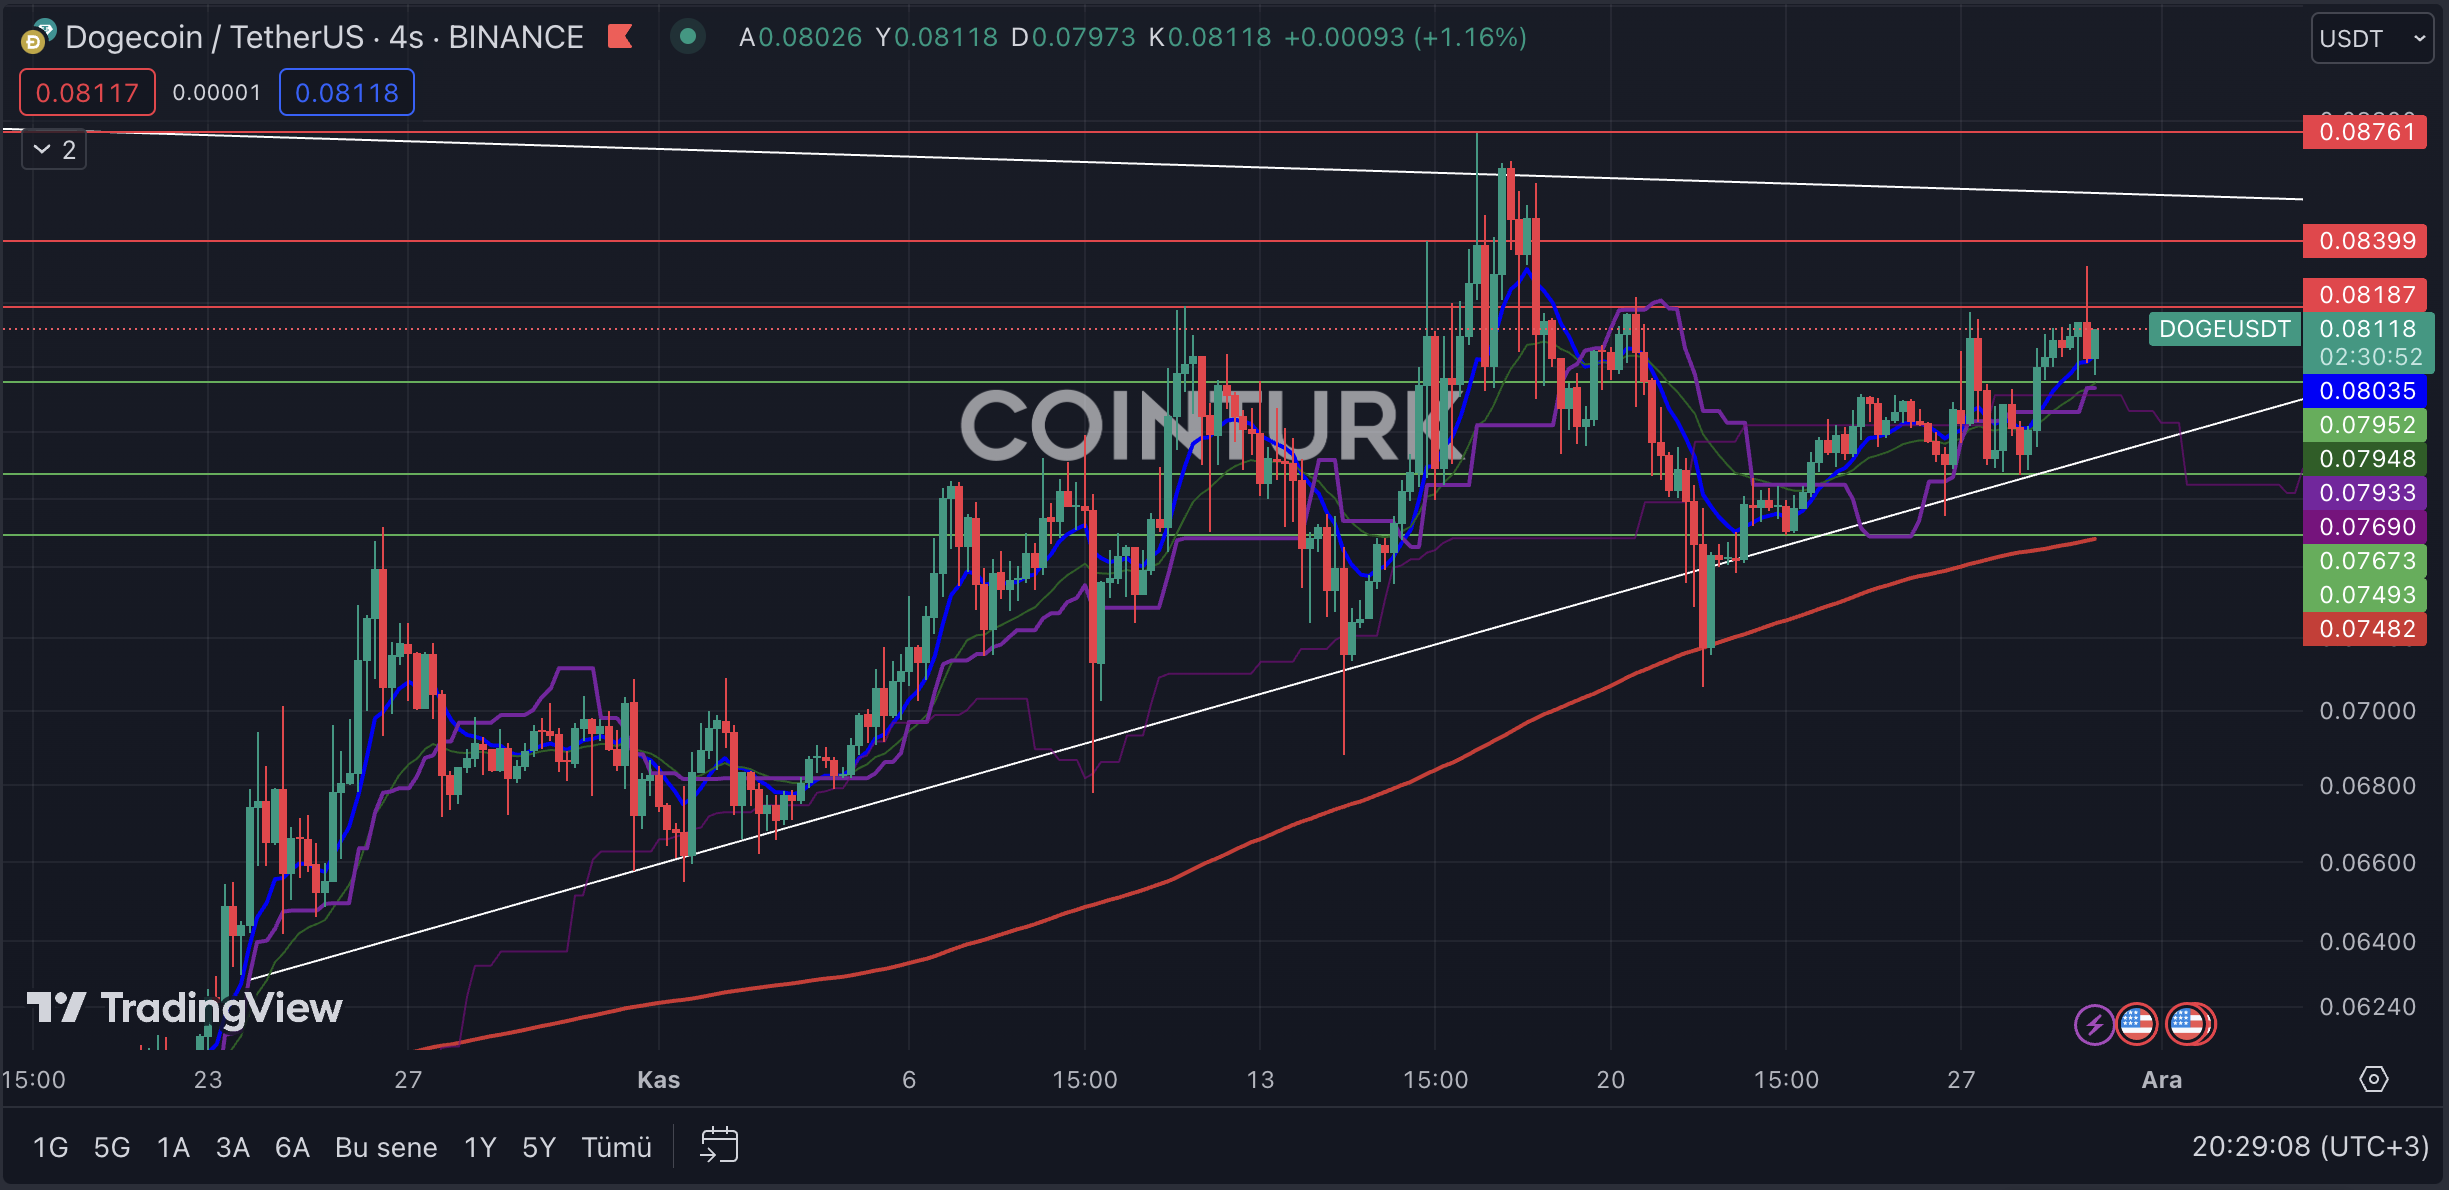
The first noticeable pattern in the four-hour Dogecoin chart is an inverse triangle formation. While traditionally seen as a negative scenario in traditional markets, a breakout of resistance could invalidate this outlook. Finding support at the EMA 200 level during a support breakdown could be a significant factor in an uptrend.
四小时狗狗币图表中第一个值得注意的模式是倒三角形形态。虽然传统上被视为传统市场的负面情况,但突破阻力位可能会使这一前景失效。在支撑位崩溃期间在 EMA 200 水平寻找支撑位可能是上升趋势的一个重要因素。
The most important support levels to follow on the four-hour chart for DOGE are $0.07952, $0.07673, and $0.07493, respectively. A bar closing below the $0.07673 level, which intersects with the support line, could lead to a long-term decline in DOGE’s momentum.
DOGE 四小时图表上最重要的支撑位分别为 0.07952 美元、0.07673 美元和 0.07493 美元。如果收盘价低于与支撑线相交的 0.07673 美元水平,可能会导致 DOGE 动能长期下降。
The critical resistance levels to watch on DOGE’s four-hour chart are $0.08187, $0.08399, and $0.08761, respectively. A bar closing above the $0.08761 level would signify a resistance breakout and could accelerate DOGE’s momentum.
DOGE 四小时图表上值得关注的关键阻力位分别为 0.08187 美元、0.08399 美元和 0.08761 美元。收盘价高于 0.08761 美元水平将意味着突破阻力位,并可能加速 DOGE 的势头。
- Technical analysis is vital for crypto investors.
- Support and resistance levels guide DOGE’s trajectory.
- Chart patterns suggest potential DOGE price movements.
技术分析对于加密货币投资者至关重要。
支撑位和阻力位引导 DOGE 的轨迹。
图表模式表明潜在的 DOGE 价格走势。
继续阅读:https://en.coin-turk.com/unraveling-dogecoins-future-a-technical-analysis-of-market-trajectories/
 DeFi Planet
 Crypto Daily™
 BlockchainReporter
 TheCoinrise Media
 DogeHome
 Crypto Daily™
 Crypto Daily™
 TheCoinrise Media


