In the cryptocurrency market, technical analysis stands as a crucial indicator, particularly for investors trading in the futures market. What insights does technical analysis provide for Dogecoin, which at the time of writing is trading at $0.08103? We examine this through detailed chart analysis and by looking at key support and resistance levels.
暗号通貨市場では、特に先物市場で取引する投資家にとって、テクニカル分析が重要な指標となります。テクニカル分析は、執筆時点で0.08103ドルで取引されているDogecoinにどのような洞察を提供しますか?詳細なチャート分析を通じて、また主要なサポートとレジスタンスのレベルを調べることで、これを検証します。
Dogecoin Daily Chart Analysis
ドージコイン日足チャート分析
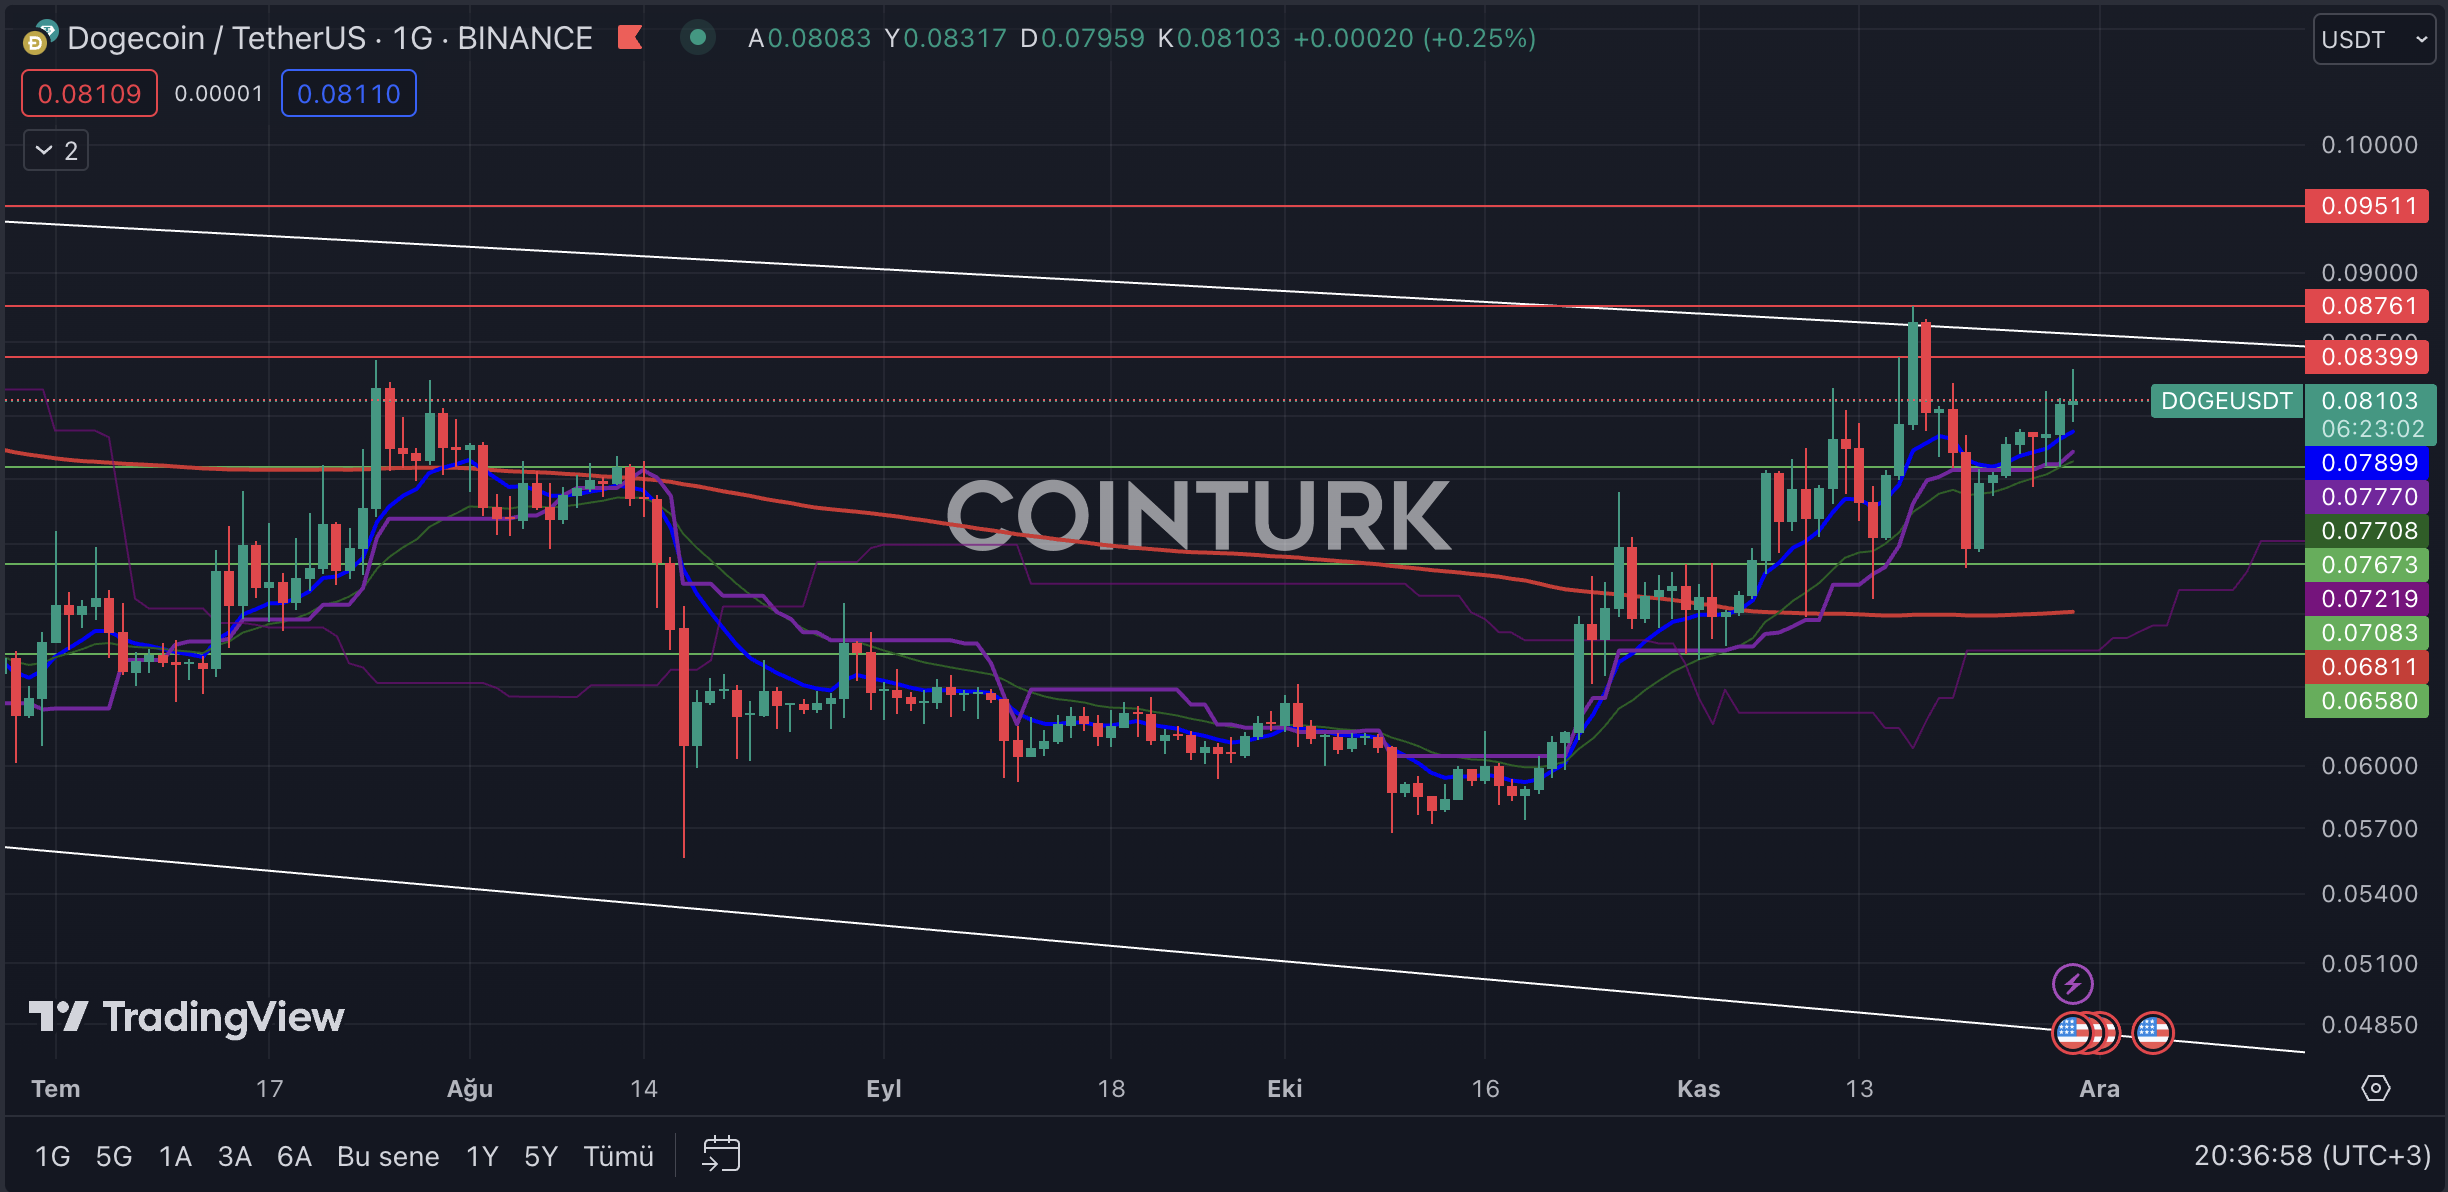
On Dogecoin’s daily chart, the first prominent pattern is a descending channel formation. After touching the resistance line on November 17th, DOGE encountered a significant hurdle and, following selling pressure, regained an upward momentum. The recent decrease in volatility during the last few bars could potentially slow down DOGE’s short-term pace.
ドージコインの日足チャートでは、最初の顕著なパターンは下降チャネル形成です。 11月17日にレジスタンスラインに触れた後、DOGEは大きなハードルに遭遇し、売り圧力を受けて上昇の勢いを取り戻しました。最近の数バーのボラティリティの低下により、DOGE の短期的なペースが鈍化する可能性があります。
The most critical support levels to monitor on DOGE’s daily chart are $0.07673, $0.07083, and $0.06580, respectively. A daily bar closing below the $0.06580 level would lead to DOGE trading below the EMA 200 (red line), which could signify a long-term loss in momentum.
DOGEの日足チャートで監視すべき最も重要なサポートレベルは、それぞれ0.07673ドル、0.07083ドル、0.06580ドルです。日足が0.06580ドルのレベルを下回って終了すると、DOGEはEMA 200(赤い線)を下回って取引されることになり、これは長期的な勢いの喪失を意味する可能性があります。
The key resistance levels on DOGE’s daily chart are $0.08399, $0.08761, and $0.09511, respectively. A daily bar closing above the $0.08761 level would break the formation resistance and could lead to DOGE reaching its highest price in recent times.
DOGE の日足チャートの主要な抵抗レベルは、それぞれ 0.08399 ドル、0.08761 ドル、0.09511 ドルです。日足が0.08761ドルのレベルを超えて終了すると、形成抵抗を突破し、DOGEが最近の最高値に達する可能性があります。

Dogecoin Four-Hour Chart Analysis
ドージコイン4時間足チャート分析
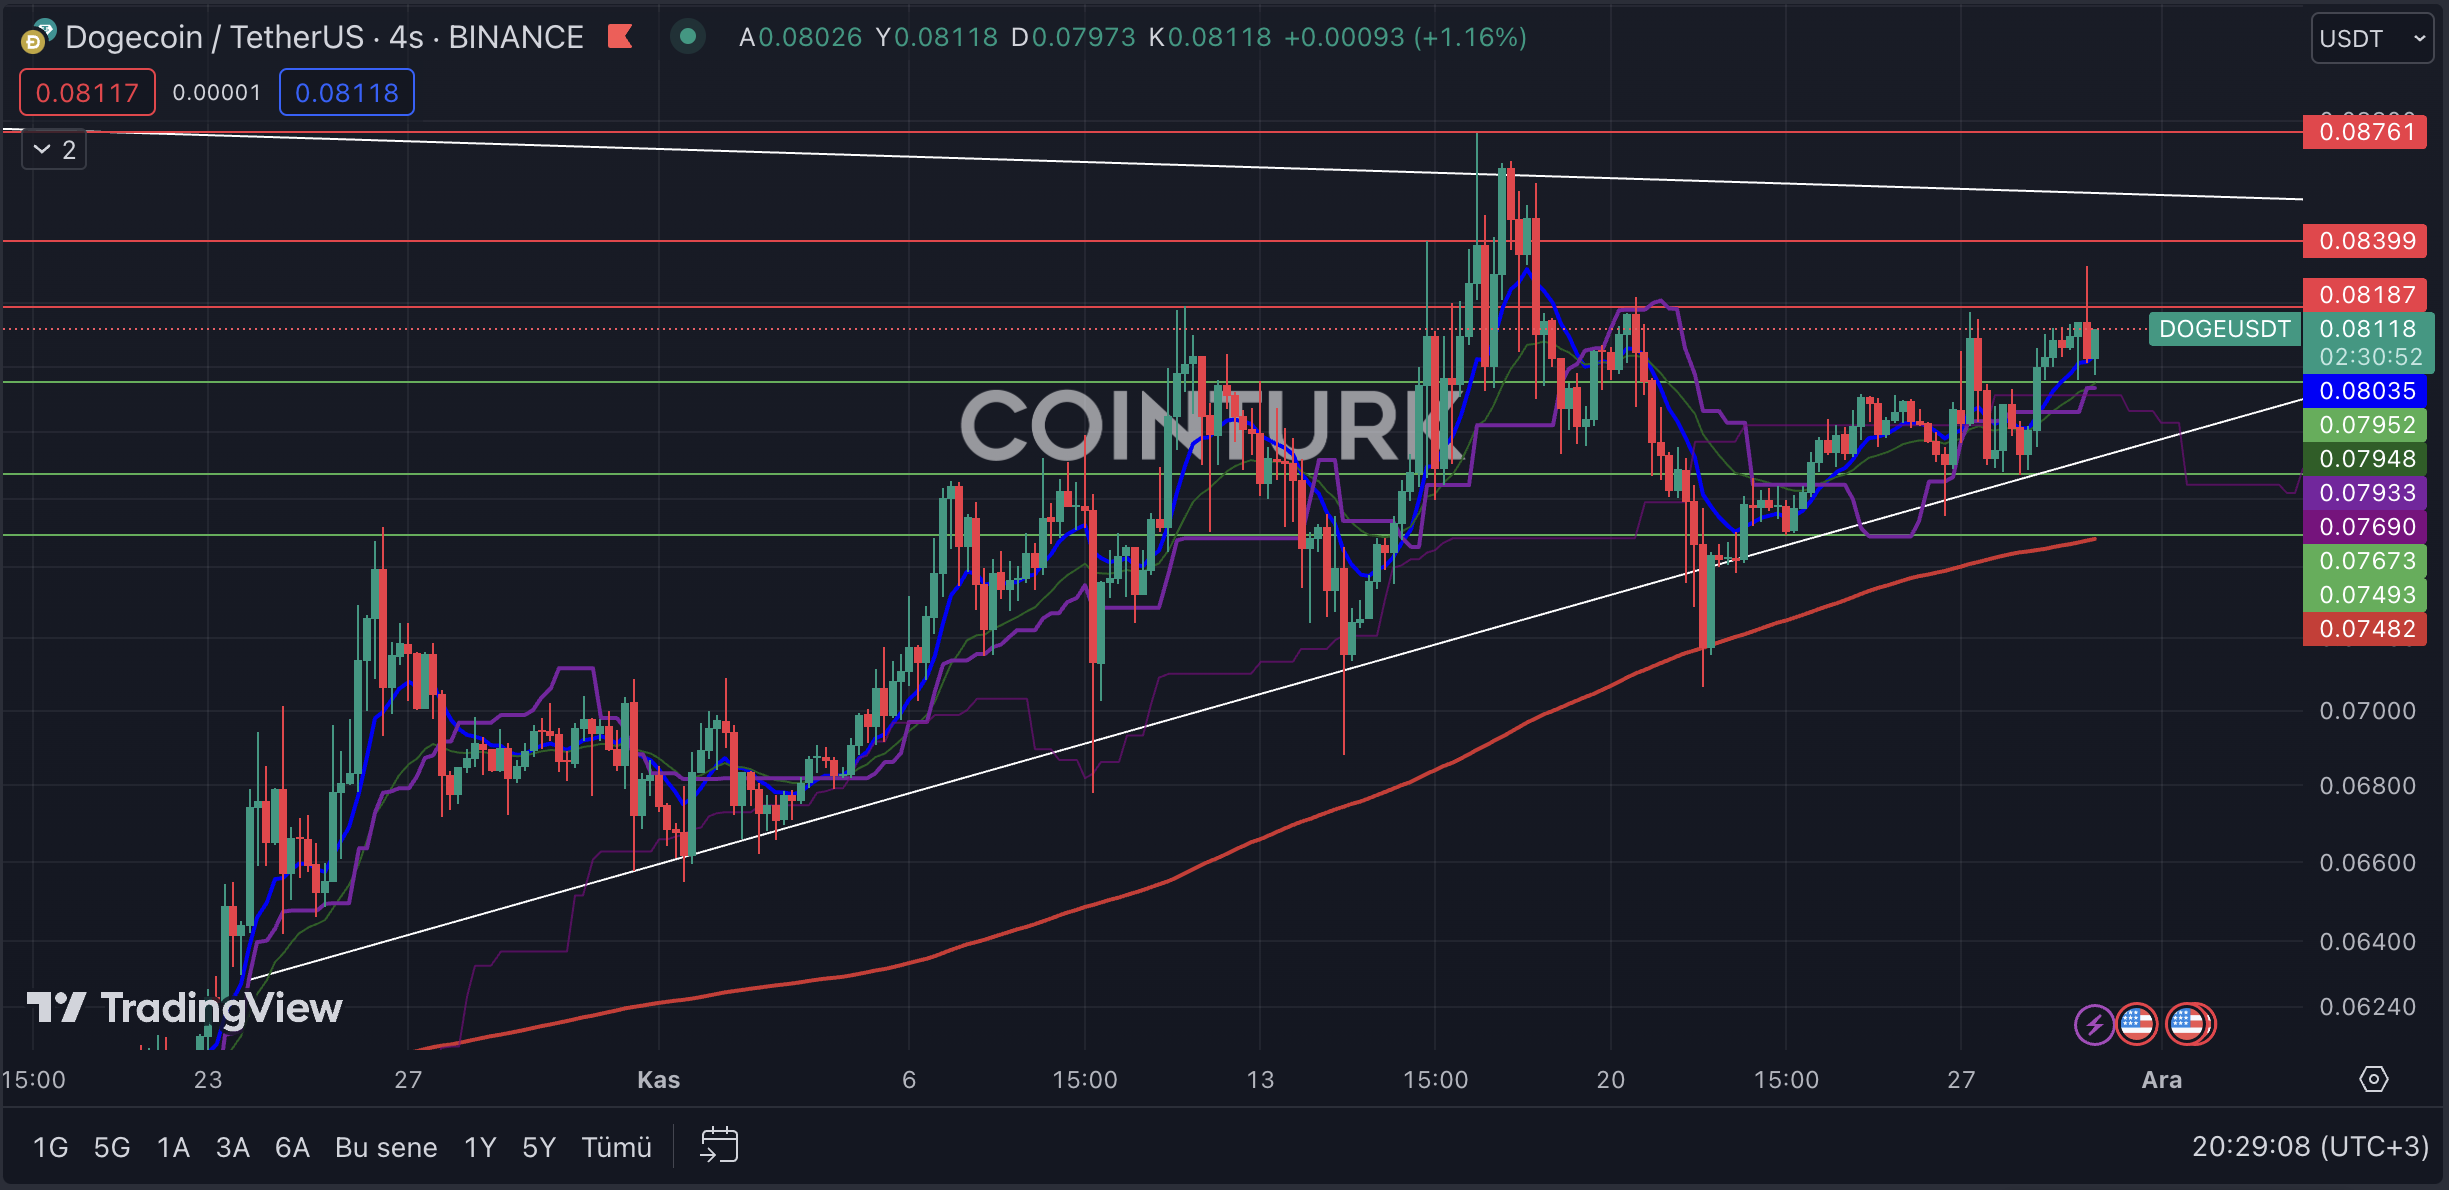
The first noticeable pattern in the four-hour Dogecoin chart is an inverse triangle formation. While traditionally seen as a negative scenario in traditional markets, a breakout of resistance could invalidate this outlook. Finding support at the EMA 200 level during a support breakdown could be a significant factor in an uptrend.
ドージコインの 4 時間足チャートで最初に注目すべきパターンは、逆三角形の形成です。伝統的な市場では伝統的にネガティブなシナリオとみなされてきましたが、レジスタンスの勃発によってこの見通しが無効になる可能性があります。サポートが崩れているときにEMA 200レベルでサポートを見つけることが、上昇トレンドの重要な要因となる可能性があります。
The most important support levels to follow on the four-hour chart for DOGE are $0.07952, $0.07673, and $0.07493, respectively. A bar closing below the $0.07673 level, which intersects with the support line, could lead to a long-term decline in DOGE’s momentum.
DOGEの4時間足チャートで従うべき最も重要なサポートレベルは、それぞれ0.07952ドル、0.07673ドル、0.07493ドルです。サポートラインと交差する0.07673ドルのレベルを下回ってバーが終了すると、DOGEの勢いが長期的に低下する可能性があります。
The critical resistance levels to watch on DOGE’s four-hour chart are $0.08187, $0.08399, and $0.08761, respectively. A bar closing above the $0.08761 level would signify a resistance breakout and could accelerate DOGE’s momentum.
DOGEの4時間足チャートで注目すべき重要な抵抗レベルは、それぞれ0.08187ドル、0.08399ドル、0.08761ドルです。バーが0.08761ドルのレベルを超えて終了した場合は、レジスタンスのブレイクアウトを意味し、DOGEの勢いが加速する可能性があります。

- Technical analysis is vital for crypto investors.
- Support and resistance levels guide DOGE’s trajectory.
- Chart patterns suggest potential DOGE price movements.
テクニカル分析は仮想通貨投資家にとって不可欠です。
サポートとレジスタンスのレベルが DOGE の軌道を導きます。
チャートのパターンは、DOGE の価格変動の可能性を示唆しています。
続きを読む: https://en.coin-turk.com/unraveling-dogecoins-future-a-technical-analysis-of-market-trajectories/


 DogeHome
 TheCoinrise Media
 Thecoinrepublic.com
 TheCoinrise Media
 TheCoinrise Media
 Cryptopolitan_News
 Coin Edition
 BlockchainReporter


