

In the most recent week, the cryptocurrency market has seen a mix of bullish and bearish trends, with most cryptocurrencies trading in neutral ranges. The weekly crypto price analysis reveals a market has been struggling to find direction, with most of the tokens seeing gains rather than losses. The market has been volatile, and buying and selling opportunities abound.
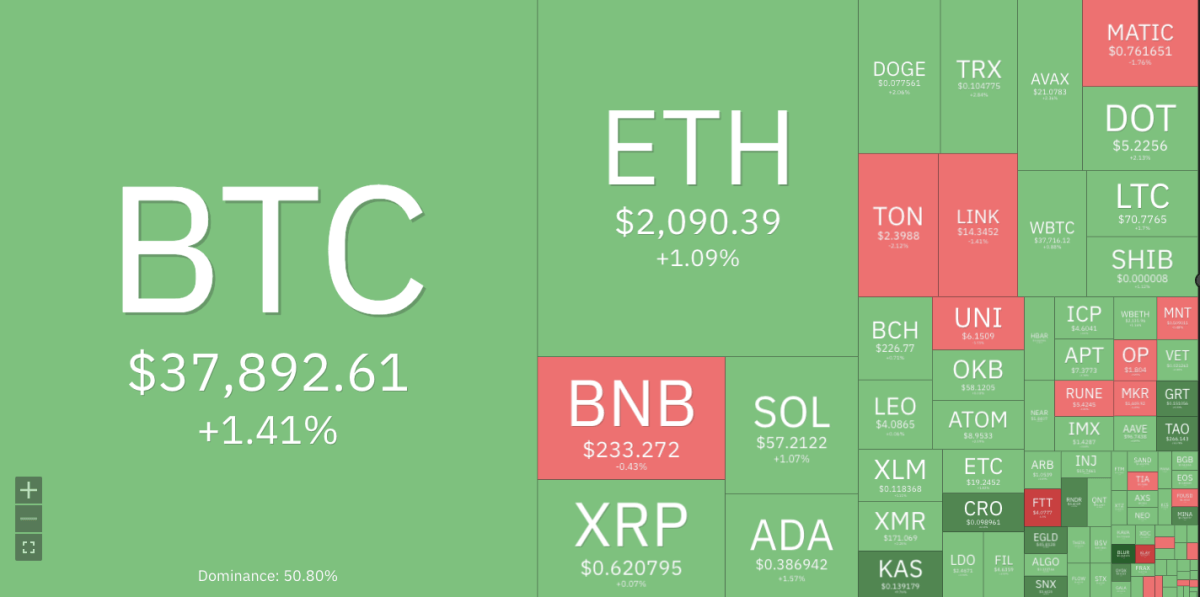
Cryptocurrencies Price Heatmap, Source: Coin360
The leading cryptocurrency, Bitcoin (BTC), has managed to hold its position above $37k after a bullish outlook in the past week. The ETH price has also been showing bullish signs, with the token trading above $2k. Additionally, the XRP and ADA prices have gained momentum, with both tokens seeing a significant increase in value. However, not all cryptocurrencies have been on an upward trajectory. BNB’s price has been relatively stable after a bearish outlook, while Dogecoin (DOGE) and Solana (SOL) are experiencing a slight downward trend.
BTC/USD
BTC started the week on a positive note, with its price rising above $36K. The bullish trend continued throughout the week, and the token’s price reached $37k before showing signs of consolidation. The BTC dominance percentage has been around 50%, indicating a strong hold on the market.
BTC/USD is currently trading at $37,892, with a 24-hour surge of 1.41% and a seven-day increase of 3.48%. If bullish momentum continues, BTC’s price will reach its next resistance level at $40k. However, if bears take control, BTC’s price could drop to its support level of $35k.
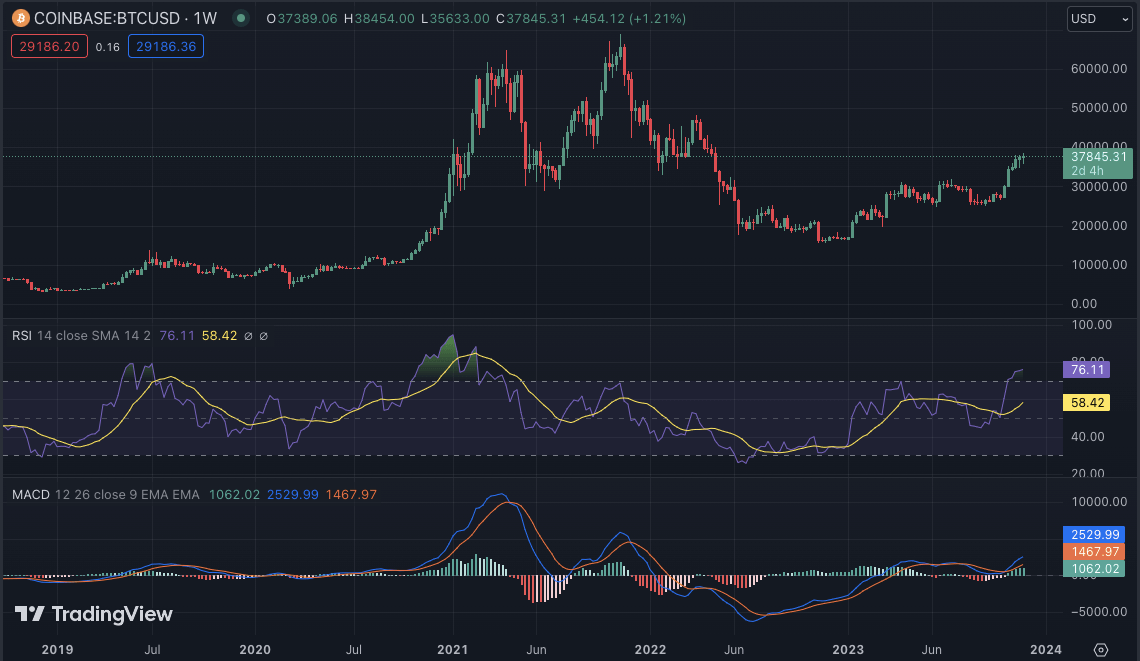
BTC/USD weekly chart, source: TradingView
The weekly technical indicators are indicating a possible bullish momentum for BTC. The MACD (Moving Average Convergence Divergence) histogram shows an upward trend, and the RSI (Relative Strength Index) is above 70, indicating a buying sentiment in the market. The 20-EMA and 50-EMA also show bullish crossovers, confirming a positive BTC outlook.
ETH/USD
ETH has been showing a bullish outlook, with its price breaking above the $2k mark multiple times in the past week. The token reached a weekly high of $2,123 but was met with resistance and consolidated around the $2,1k level. ETH token has been hovering between $2k and 2,1k, with bullish and bearish forces struggling for control. At the time of writing, ETH is trading at $2,090, with a seven-day strong surge of 7%.
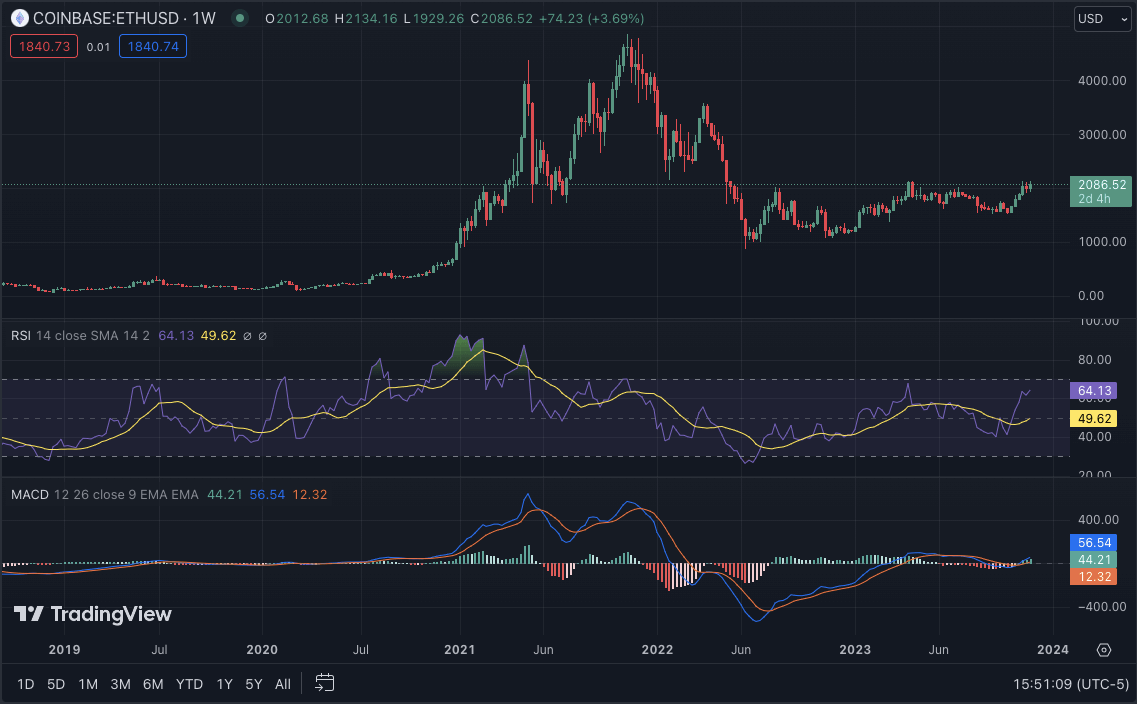
ETH/USD weekly chart, source: TradingView
ETH/USD has strong support at $2k, with a resistance level of $2.1k. If bulls dominate the market, ETH’s price could break above its current resistance and reach $2,200. On the other hand, if bears take over, ETH’s price could drop to its support level of $1,900.
The 50-SMA and 200-SMA on the weekly chart show a potential bullish crossover, indicating a positive outlook for ETH. The moving average convergence/divergence (MACD) also shows a bullish trend, while the relative strength index (RSI) is above 60, indicating strong buying pressure in the market. The moving averages are indicating buy signals, supporting the overall bullish sentiment.
BNB/USD
BNB has been trading in a tight range, with its price hovering between $300 and $320. The token saw a slight downward trend in the past week, reaching a low of $286 before bouncing back to its current price of $230 levels. The bulls and bears have been struggling for control, resulting in a relatively stable market for BNB. Currently, BNB is trading at $233, with a weekly dip of 4.46%.
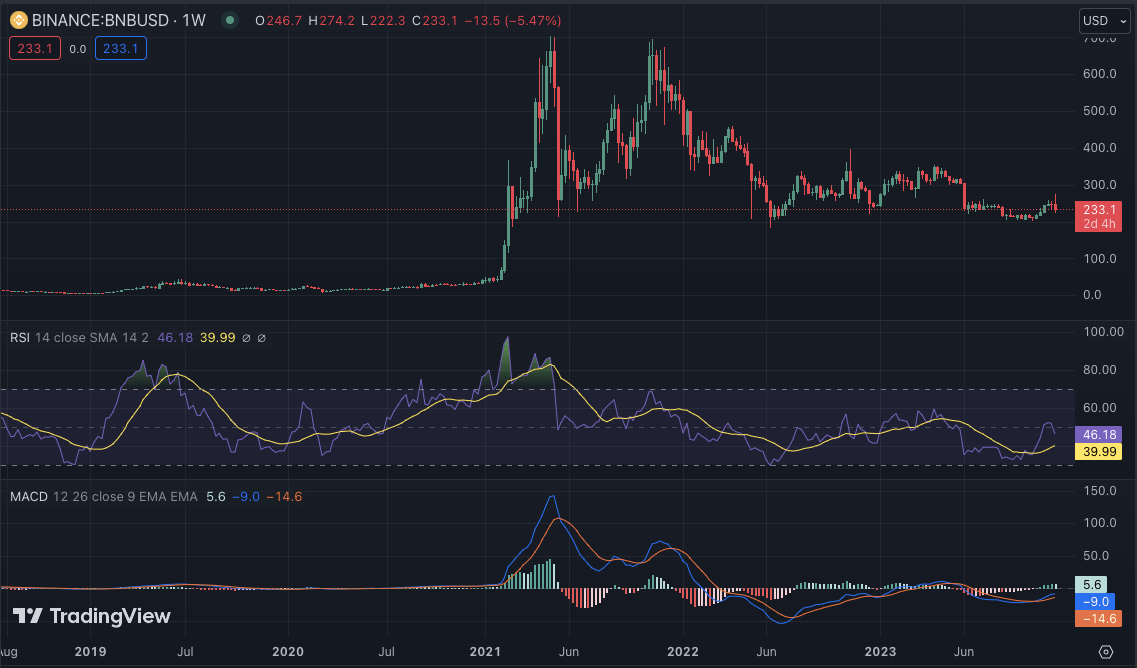
BNB/USD weekly chart, source: TradingView
The technical indicators for BNB show a potential bearish trend in the near future. The RSI is currently below 50, indicating a selling sentiment and the MACD histogram shows signs of a bearish crossover. The MACD line is also below the signal line, confirming a negative outlook for BNB. The 100-SMA and 200-SMA also show a bearish crossover, indicating a possible further downward trend for BNB.
XRP/USD
XRP saw a significant surge in its price this week, reaching a weekly high of $0.628 before consolidating around the $0.61 level. The token’s bullish momentum has been driven by positive market sentiment and recent partnerships. XRP token has been rallying above its previous resistance level of $0.60, indicating a strong surge in value. XRP is currently trading at $0.6270 level, with a weekly increase of 2%.
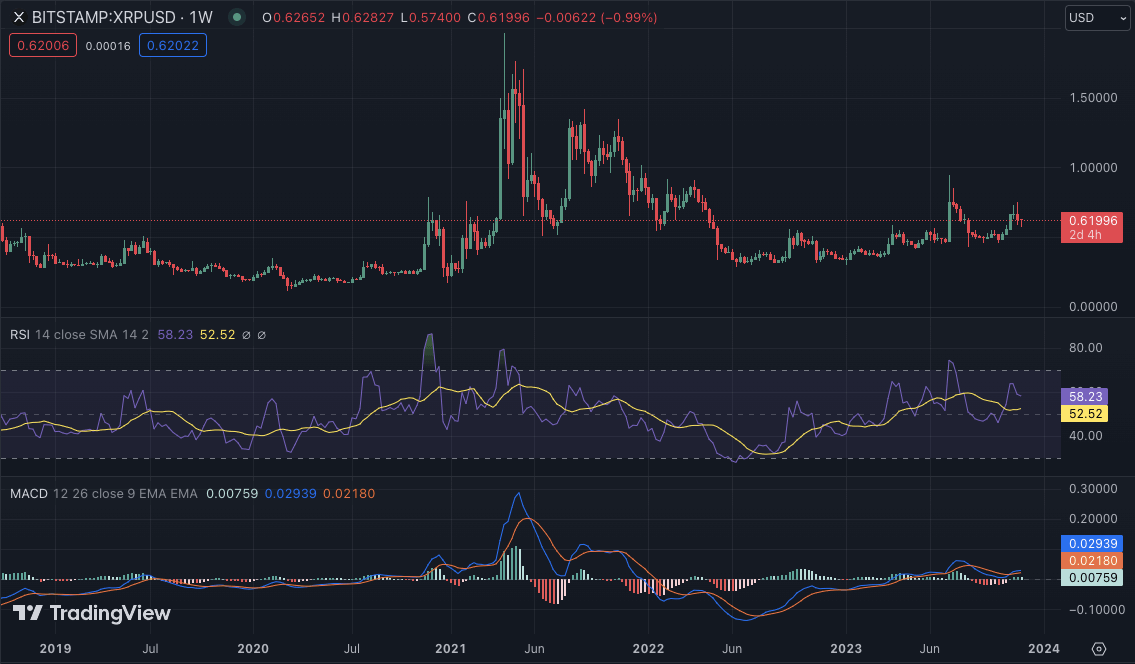
XRP/USD weekly chart, source: TradingView
XRP/USD has strong support at $0.58, with its next resistance level at $0.6300. If bulls continue to dominate the market, XRP’s price could reach its next resistance level at $0.6500. However, if bears take control, XRP’s price could drop to its support level of $0.58.
The technical indicators for XRP show a potential bullish trend in the near future. The RSI is currently above 50, indicating bulls are more dominant in the market. The MACD histogram also shows a bullish trend and the 50-SMA and 100-SMA show signs of a potential bullish crossover.
SOL/USD
Weekly crypto price analysis also reveals that Solana (SOL) has been trading in a downward trend. The token saw a significant drop in its price from $62 to $57 before bouncing back to its current level of $57.10. SOL’s bearish movement is attributed to overall market sentiment and profit-taking by investors. SOL has seen a weekly dip of 1.8%, with its value fluctuating within a tight range.
SOL/USD has a strong support level of $30 and a resistance level of $35. If bulls take control, SOL’s price could reach its next resistance level at $40. However, if bears continue to dominate, SOL’s price could drop to its support level of $25. However, today, it saw a surge of 1.24%, giving hope to the bullish investors.
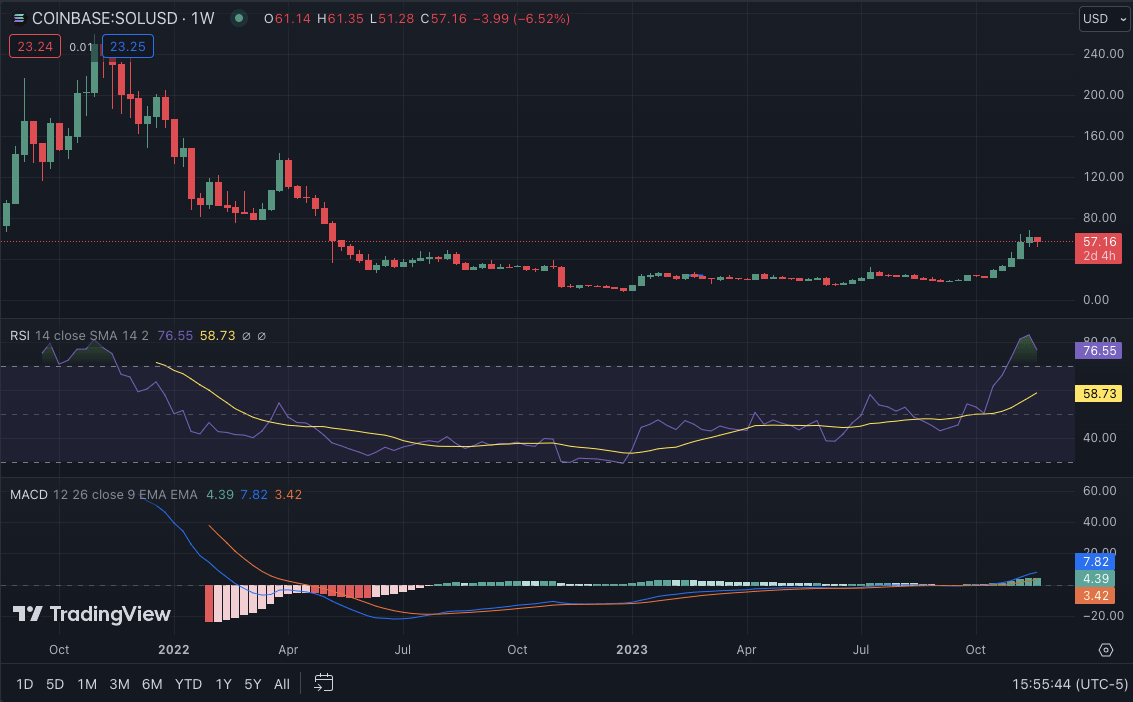
SOL/USD weekly chart, source: TradingView
The technical indicators for SOL show mixed signals, with the RSI below 80 but showing signs of an upward trend. The MACD histogram shows a possible bullish crossover, while the moving averages indicate a buy signal. Overall, SOL’s price movement will depend on market sentiment and the direction of major cryptocurrencies. The 20-EMA and 50-EMA show bullish crossovers, indicating a possible upward movement for SOL in the near future.
ADA/USD
Looking at the DOGE weekly price analysis, bulls and bears have been fighting for control, resulting in a relatively stable market for ADA. The bulls seem to be winning the battle, with ADA’s price surging by more than 6% in the past week. The token currently trades at $0.3862, with a 24-hour increase of 1.82%. The trading volume for ADA has also increased, indicating a possible surge in value in the coming days.
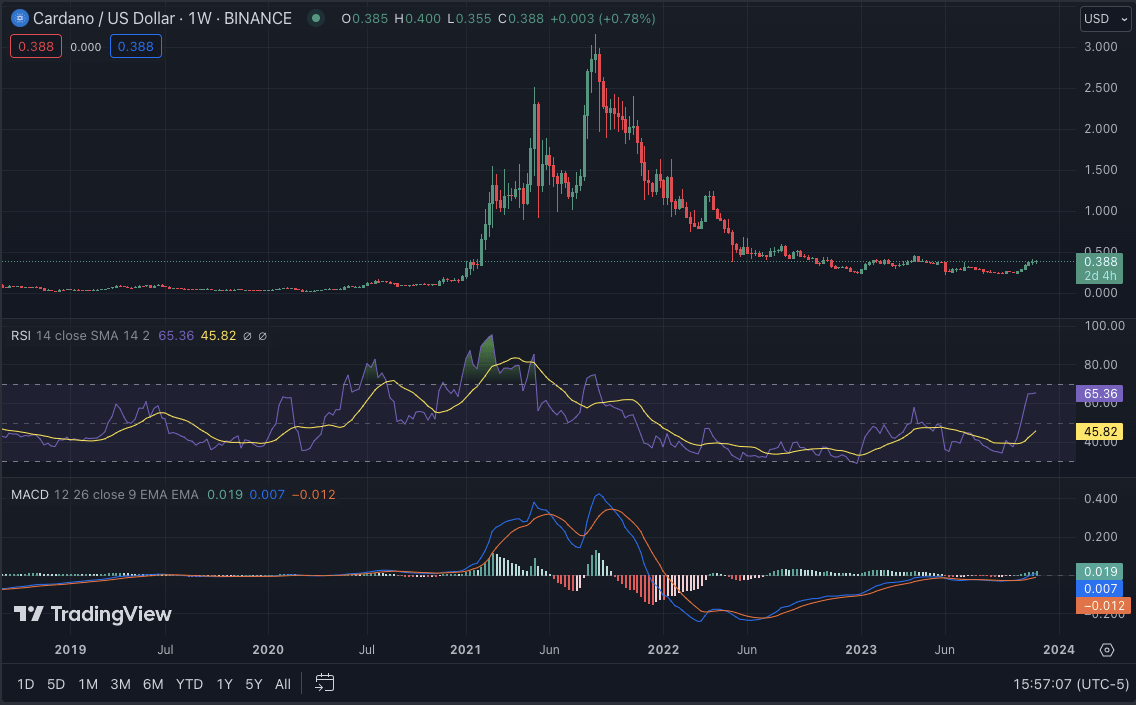
ADA/USD weekly chart, source: TradingView
The technical indicators for ADA show a potential bullish trend in the near future. The RSI is currently above 60, indicating strong buying pressure from investors. The MACD histogram also shows signs of a bullish trend, while the moving averages indicate buy signals. If bulls continue to dominate, ADA could reach its next resistance level at $0.4000. On the other hand, if bears take over, ADA’s price could drop to its support level of $0.03500.
DOGE/USD
DOGE has been trading sideways for most of the week, fluctuating prices between $0.0700 and $0.08000. However, towards the end of the week, DOGE saw a slight dip in its price, reaching $0.19 before recovering to its current trading price of $0.07155. Over the past seven days, DOGE has seen a 7% decrease in value. At the time of writing, DOGE/USD is trading at $0.07735, with a slight increase of 1.90% in the past 24 hours.
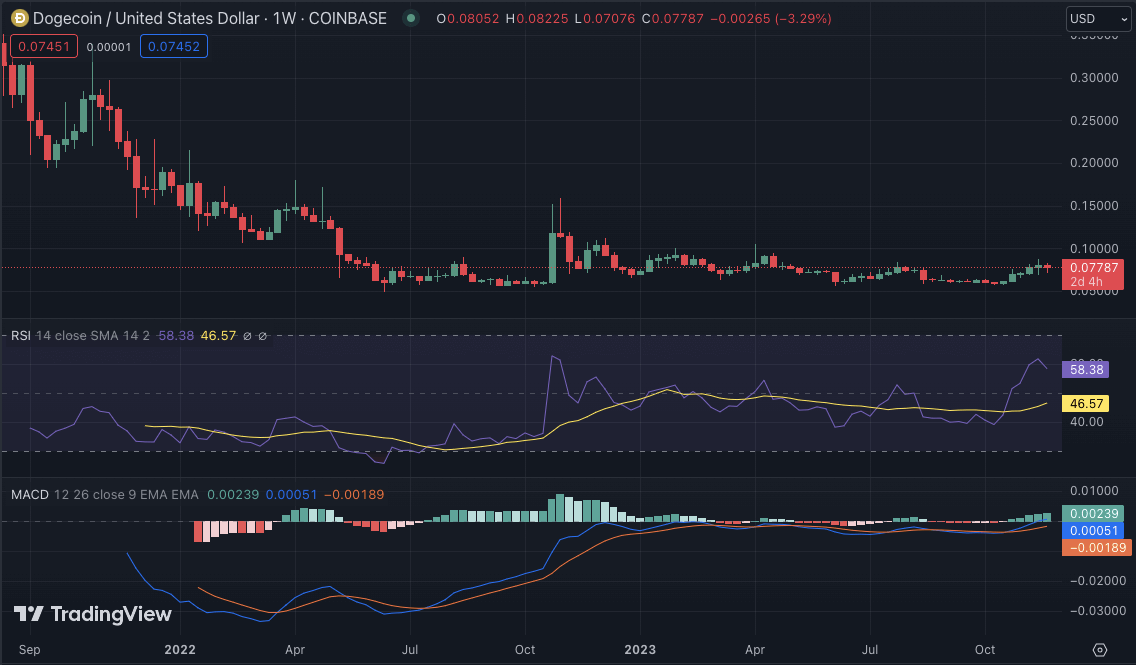
DOGE/USD weekly chart, Source: TradingView
The technical indicators for DOGE show a possible continuation of the bearish trend in the coming days. The RSI is currently below 60, indicating neutral sentiment in the market, and if it continues to drop, it could indicate a further downward trend for DOGE. The MACD also shows signs of a bearish crossover, and the 50-SMA is below the 200-SMA, confirming a negative outlook for DOGE.
Conclusion
In conclusion, the weekly crypto price analysis shows a mixed sentiment in the market for major cryptocurrencies. The bulls and bears struggle for control, resulting in a relatively stable market. However, technical indicators show potential bullish or bearish trends for each token, depending on market sentiment and the direction of major cryptocurrencies such as Bitcoin and Ethereum. In the coming week, it will be interesting to see if the bulls or bears gain dominance and how it will affect the price movements of these cryptocurrencies.
 BlockchainReporter
 CoinPedia News
 TheNewsCrypto
 CFN
CFN DogeHome
 Optimisus
 Crypto News Land
 Optimisus


