

In the most recent week, the cryptocurrency market has seen a mix of bullish and bearish trends, with most cryptocurrencies trading in neutral ranges. The weekly crypto price analysis reveals a market has been struggling to find direction, with most of the tokens seeing gains rather than losses. The market has been volatile, and buying and selling opportunities abound.
直近 1 週間の仮想通貨市場では強気と弱気のトレンドが混在しており、ほとんどの仮想通貨は中立の範囲で取引されています。毎週の暗号通貨価格分析では、ほとんどのトークンが損失ではなく利益を得ており、市場が方向性を見出すのに苦労していることが明らかになった。市場は不安定であり、売買の機会は豊富にあります。
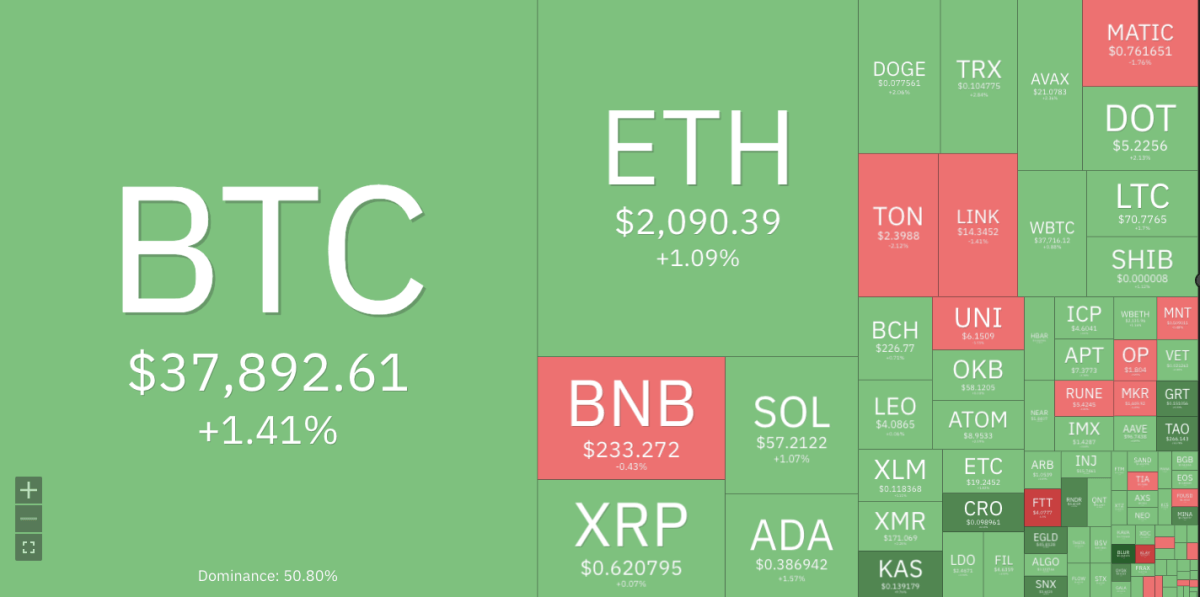
Cryptocurrencies Price Heatmap, Source: Coin360
暗号通貨価格ヒートマップ、出典: Coin360
The leading cryptocurrency, Bitcoin (BTC), has managed to hold its position above $37k after a bullish outlook in the past week. The ETH price has also been showing bullish signs, with the token trading above $2k. Additionally, the XRP and ADA prices have gained momentum, with both tokens seeing a significant increase in value. However, not all cryptocurrencies have been on an upward trajectory. BNB’s price has been relatively stable after a bearish outlook, while Dogecoin (DOGE) and Solana (SOL) are experiencing a slight downward trend.
主要な暗号通貨であるビットコイン(BTC)は、先週の強気見通しの後、なんとか3万7000ドルを超えるポジションを維持している。 ETH価格も強気の兆しを見せており、トークンは2,000ドルを超えて取引されています。さらに、XRPとADAの価格は勢いを増しており、両方のトークンの価値が大幅に上昇しています。ただし、すべての仮想通貨が上昇軌道に乗っているわけではありません。 BNBの価格は弱気見通しの後比較的安定していますが、ドージコイン(DOGE)とソラナ(SOL)はわずかに下落傾向にあります。
BTC/USD
BTC/米ドル
BTC started the week on a positive note, with its price rising above $36K. The bullish trend continued throughout the week, and the token’s price reached $37k before showing signs of consolidation. The BTC dominance percentage has been around 50%, indicating a strong hold on the market.
BTC は今週を好調にスタートし、価格は 36,000 ドルを超えました。強気の傾向は今週を通じて続き、トークンの価格は37,000ドルに達し、その後、統合の兆候が見られました。 BTC の支配率は約 50% であり、市場を強力に保持していることを示しています。
BTC/USD is currently trading at $37,892, with a 24-hour surge of 1.41% and a seven-day increase of 3.48%. If bullish momentum continues, BTC’s price will reach its next resistance level at $40k. However, if bears take control, BTC’s price could drop to its support level of $35k.
BTC/USD は現在 37,892 ドルで取引されており、24 時間で 1.41% 上昇し、7 日間で 3.48% 上昇しました。強気の勢いが続けば、BTC価格は次の抵抗線である4万ドルに達するだろう。しかし、弱気派が主導権を握った場合、BTCの価格はサポートレベルの35,000ドルまで下落する可能性があります。
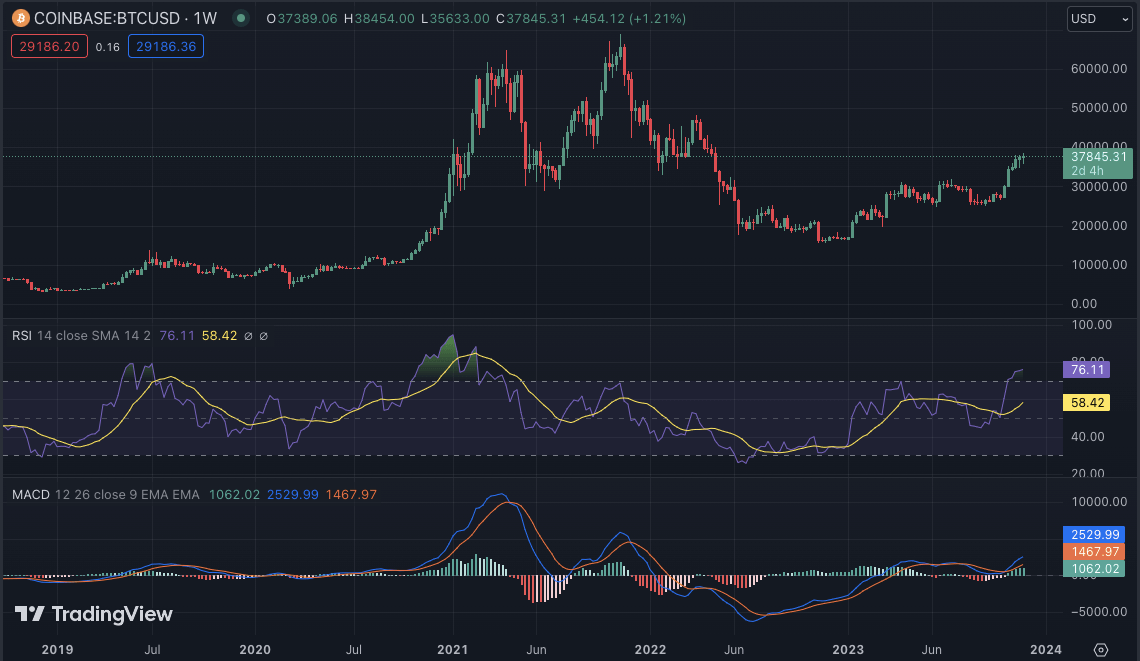
BTC/USD weekly chart, source: TradingView
BTC/USD週足チャート、出典:TradingView
The weekly technical indicators are indicating a possible bullish momentum for BTC. The MACD (Moving Average Convergence Divergence) histogram shows an upward trend, and the RSI (Relative Strength Index) is above 70, indicating a buying sentiment in the market. The 20-EMA and 50-EMA also show bullish crossovers, confirming a positive BTC outlook.
毎週のテクニカル指標は、BTC の強気の勢いの可能性を示しています。 MACD (Moving Average Convergence Divergence) ヒストグラムは上昇傾向を示しており、RSI (Relative Strength Index) は 70 を超えており、市場の買い心理を示しています。 20-EMA と 50-EMA も強気のクロスオーバーを示しており、BTC の前向きな見通しが裏付けられています。
ETH/USD
ETH/米ドル
ETH has been showing a bullish outlook, with its price breaking above the $2k mark multiple times in the past week. The token reached a weekly high of $2,123 but was met with resistance and consolidated around the $2,1k level. ETH token has been hovering between $2k and 2,1k, with bullish and bearish forces struggling for control. At the time of writing, ETH is trading at $2,090, with a seven-day strong surge of 7%.
ETHは過去1週間で価格が何度も2,000ドルを突破するなど、強気の見通しを示している。トークンは週間高値の2,123ドルに達しましたが、抵抗に遭い、2,1,000ドルのレベル付近で固められました。 ETHトークンは2,000ドルから2,1,000ドルの間で推移しており、強気派と弱気派が主導権を争っています。この記事の執筆時点で、ETHは2,090ドルで取引されており、7日間で7%の大幅な上昇を見せています。
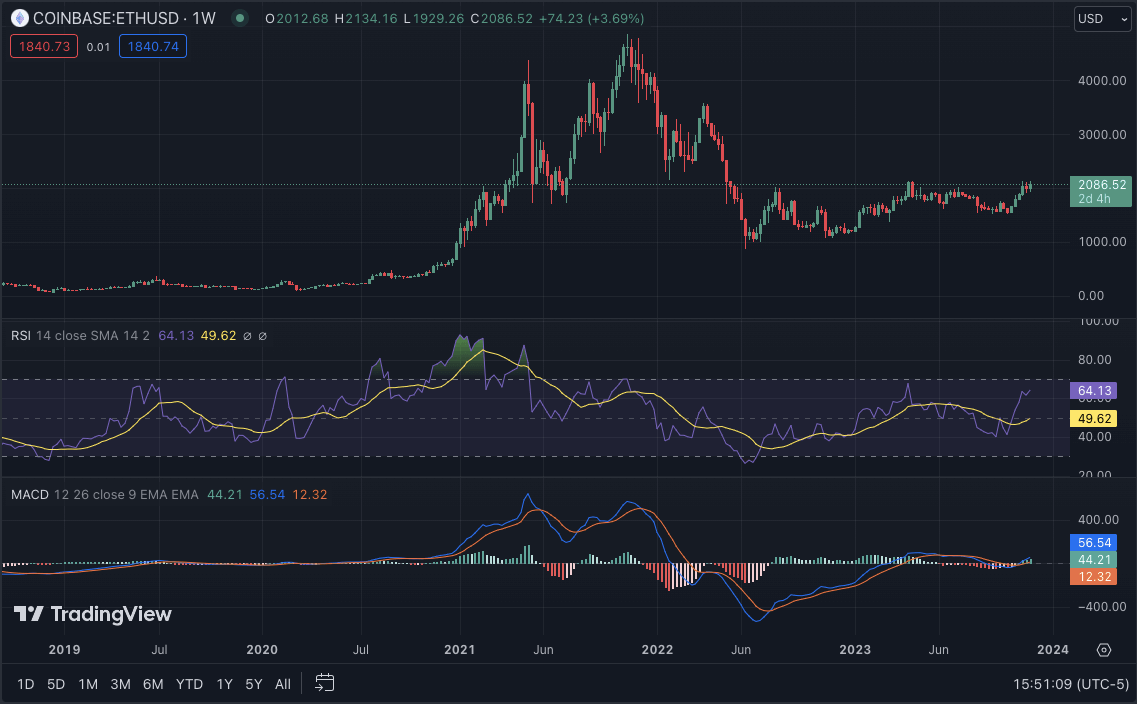
ETH/USD weekly chart, source: TradingView
ETH/USD週足チャート、出典:TradingView
ETH/USD has strong support at $2k, with a resistance level of $2.1k. If bulls dominate the market, ETH’s price could break above its current resistance and reach $2,200. On the other hand, if bears take over, ETH’s price could drop to its support level of $1,900.
ETH/USDは2,000ドルに強いサポートがあり、レジスタンスレベルは2.1,000ドルです。強気派が市場を優勢にすれば、ETHの価格は現在の抵抗線を突破し、2,200ドルに達する可能性がある。一方、弱気派が相場を引き継いだ場合、ETHの価格はサポートレベルの1,900ドルまで下落する可能性がある。
The 50-SMA and 200-SMA on the weekly chart show a potential bullish crossover, indicating a positive outlook for ETH. The moving average convergence/divergence (MACD) also shows a bullish trend, while the relative strength index (RSI) is above 60, indicating strong buying pressure in the market. The moving averages are indicating buy signals, supporting the overall bullish sentiment.
週足チャートの50-SMAと200-SMAは強気クロスオーバーの可能性を示しており、ETHの前向きな見通しを示しています。移動平均収束/発散 (MACD) も強気傾向を示しており、相対力指数 (RSI) は 60 を超えており、市場の強い買い圧力を示しています。移動平均線は買いのシグナルを示しており、全体的な強気のセンチメントを裏付けている。
BNB/USD
BNB/USD
BNB has been trading in a tight range, with its price hovering between $300 and $320. The token saw a slight downward trend in the past week, reaching a low of $286 before bouncing back to its current price of $230 levels. The bulls and bears have been struggling for control, resulting in a relatively stable market for BNB. Currently, BNB is trading at $233, with a weekly dip of 4.46%.
BNBは狭いレンジ内で取引されており、価格は300ドルから320ドルの間で推移している。このトークンは過去 1 週間で若干の下落傾向が見られ、286 ドルの安値に達した後、現在の価格である 230 ドルのレベルに戻りました。強気派と弱気派が主導権を握るために苦戦しており、その結果BNB市場は比較的安定している。現在、BNBは233ドルで取引されており、週間で4.46%下落しています。
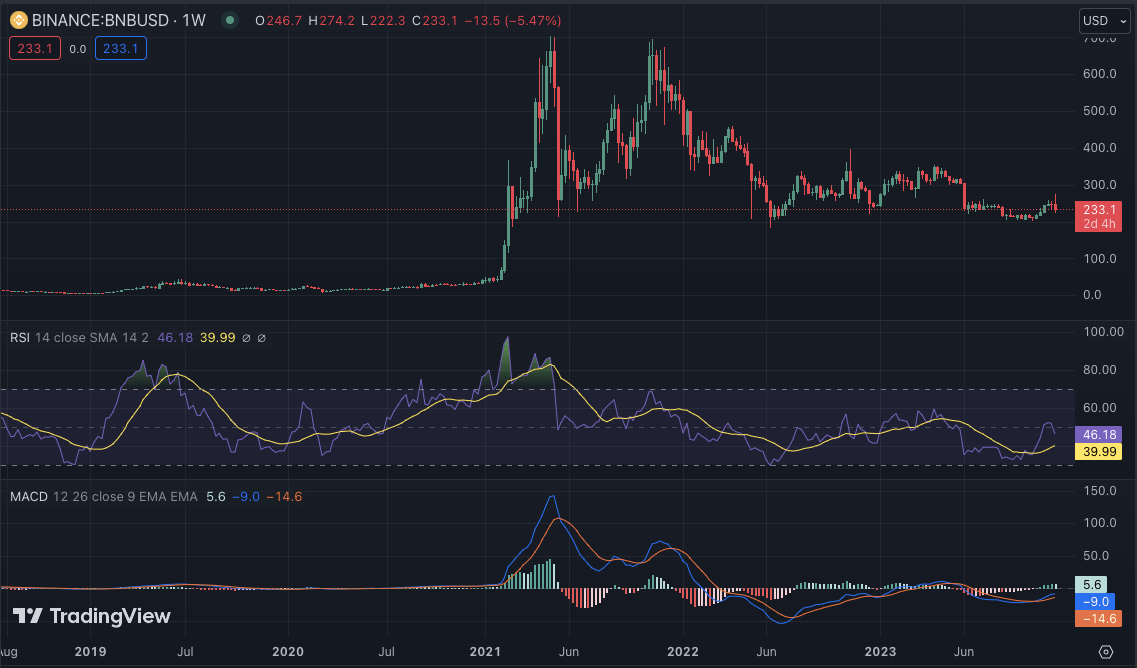
BNB/USD weekly chart, source: TradingView
BNB/USD週足チャート、出典:TradingView
The technical indicators for BNB show a potential bearish trend in the near future. The RSI is currently below 50, indicating a selling sentiment and the MACD histogram shows signs of a bearish crossover. The MACD line is also below the signal line, confirming a negative outlook for BNB. The 100-SMA and 200-SMA also show a bearish crossover, indicating a possible further downward trend for BNB.
BNB のテクニカル指標は、近い将来に弱気傾向になる可能性を示しています。 RSIは現在50を下回っており、売りセンチメントを示しており、MACDヒストグラムは弱気クロスオーバーの兆候を示しています。 MACDラインもシグナルラインを下回っており、BNBのネガティブな見通しが裏付けられています。 100-SMA と 200-SMA も弱気のクロスオーバーを示しており、BNB がさらに下降傾向にある可能性を示しています。
XRP/USD
XRP/米ドル
XRP saw a significant surge in its price this week, reaching a weekly high of $0.628 before consolidating around the $0.61 level. The token’s bullish momentum has been driven by positive market sentiment and recent partnerships. XRP token has been rallying above its previous resistance level of $0.60, indicating a strong surge in value. XRP is currently trading at $0.6270 level, with a weekly increase of 2%.
XRPは今週価格が大幅に上昇し、週間高値の0.628ドルに達した後、0.61ドルの水準付近で値を固めた。トークンの強気の勢いは、市場の前向きなセンチメントと最近のパートナーシップによって推進されています。 XRPトークンは以前の抵抗水準である0.60ドルを超えて上昇しており、価値の大幅な上昇を示しています。 XRPは現在0.6270ドルレベルで取引されており、週間で2%上昇している。
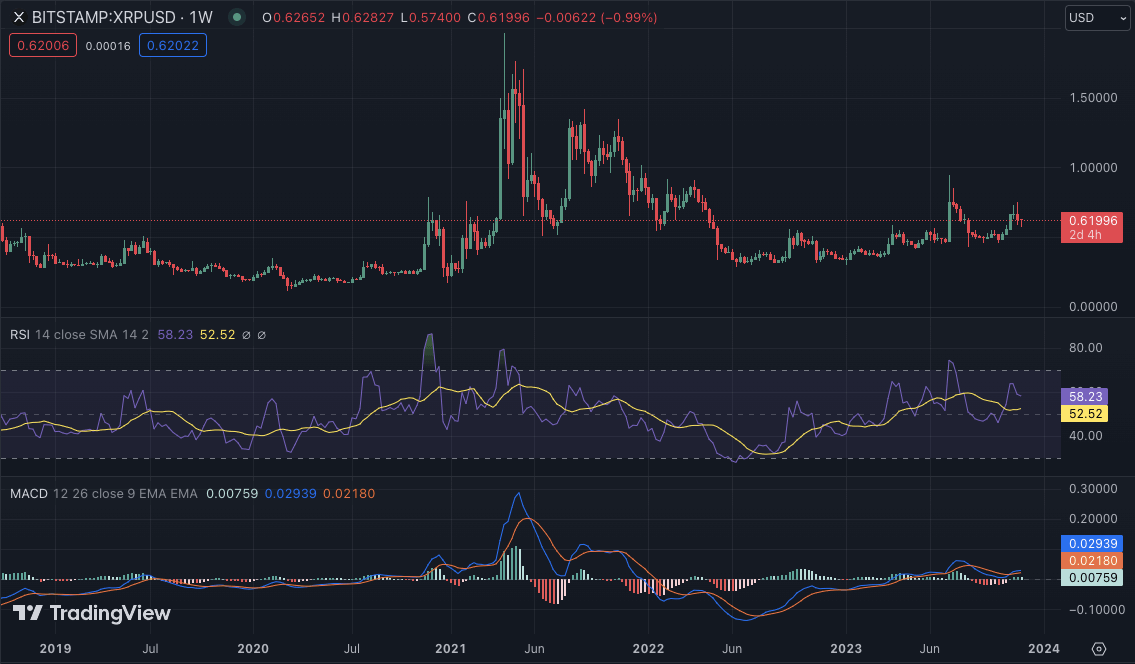
XRP/USD weekly chart, source: TradingView
XRP/USD週足チャート、出典:TradingView
XRP/USD has strong support at $0.58, with its next resistance level at $0.6300. If bulls continue to dominate the market, XRP’s price could reach its next resistance level at $0.6500. However, if bears take control, XRP’s price could drop to its support level of $0.58.
XRP/USDは0.58ドルに強い支持線があり、次の抵抗線は0.6300ドルです。強気派が市場を支配し続ければ、XRP価格は0.6500ドルの次の抵抗線に達する可能性がある。しかし、弱気派が主導権を握ると、XRPの価格はサポートレベルの0.58ドルまで下落する可能性がある。
The technical indicators for XRP show a potential bullish trend in the near future. The RSI is currently above 50, indicating bulls are more dominant in the market. The MACD histogram also shows a bullish trend and the 50-SMA and 100-SMA show signs of a potential bullish crossover.
XRPのテクニカル指標は、近い将来の潜在的な強気傾向を示しています。 RSIは現在50を超えており、市場では強気派がより優勢であることを示している。 MACD ヒストグラムも強気傾向を示しており、50-SMA と 100-SMA は潜在的な強気クロスオーバーの兆候を示しています。
SOL/USD
ソル/米ドル
Weekly crypto price analysis also reveals that Solana (SOL) has been trading in a downward trend. The token saw a significant drop in its price from $62 to $57 before bouncing back to its current level of $57.10. SOL’s bearish movement is attributed to overall market sentiment and profit-taking by investors. SOL has seen a weekly dip of 1.8%, with its value fluctuating within a tight range.
毎週の仮想通貨価格分析では、ソラナ (SOL) が下落傾向にあることも明らかになりました。トークンの価格は62ドルから57ドルに大幅に下落し、その後現在のレベルの57.10ドルに戻りました。 SOLの弱気の動きは、市場全体のセンチメントと投資家による利益確定に起因すると考えられます。 SOLは週間で1.8%下落し、その値は狭い範囲内で変動している。
SOL/USD has a strong support level of $30 and a resistance level of $35. If bulls take control, SOL’s price could reach its next resistance level at $40. However, if bears continue to dominate, SOL’s price could drop to its support level of $25. However, today, it saw a surge of 1.24%, giving hope to the bullish investors.
SOL/USD には 30 ドルの強力なサポートレベルと 35 ドルのレジスタンスレベルがあります。強気派が主導権を握ると、SOL価格は次の抵抗線である40ドルに達する可能性がある。しかし、弱気派が優勢を続ければ、SOLの価格はサポートレベルの25ドルまで下落する可能性がある。しかし、今日は1.24%上昇し、強気の投資家に期待を与えた。
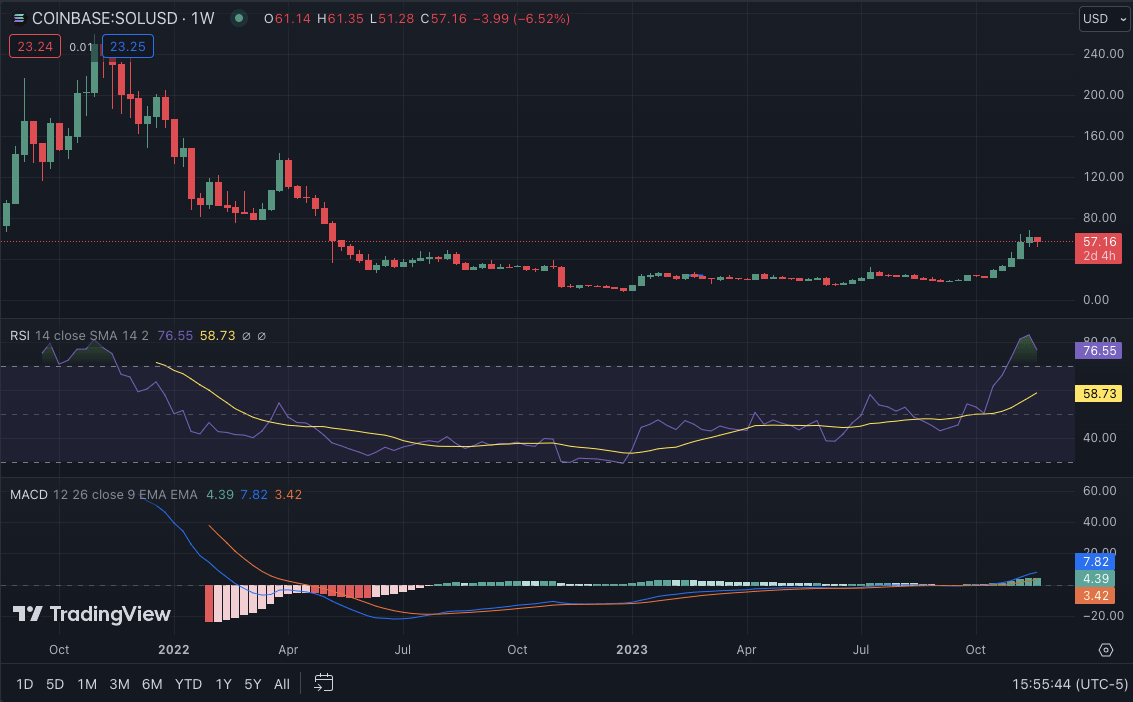
SOL/USD weekly chart, source: TradingView
SOL/USD週足チャート、出典:TradingView
The technical indicators for SOL show mixed signals, with the RSI below 80 but showing signs of an upward trend. The MACD histogram shows a possible bullish crossover, while the moving averages indicate a buy signal. Overall, SOL’s price movement will depend on market sentiment and the direction of major cryptocurrencies. The 20-EMA and 50-EMA show bullish crossovers, indicating a possible upward movement for SOL in the near future.
SOL のテクニカル指標は、RSI が 80 を下回っていますが、上昇傾向の兆候を示しており、混合シグナルを示しています。 MACD ヒストグラムは強気クロスオーバーの可能性を示し、移動平均は買いシグナルを示します。全体として、SOL の価格変動は市場センチメントと主要な仮想通貨の方向性に依存します。 20-EMA と 50-EMA は強気のクロスオーバーを示しており、近い将来 SOL が上昇する可能性があることを示しています。
ADA/USD
ADA/米ドル
Looking at the DOGE weekly price analysis, bulls and bears have been fighting for control, resulting in a relatively stable market for ADA. The bulls seem to be winning the battle, with ADA’s price surging by more than 6% in the past week. The token currently trades at $0.3862, with a 24-hour increase of 1.82%. The trading volume for ADA has also increased, indicating a possible surge in value in the coming days.
DOGE の週次価格分析を見ると、強気派と弱気派が主導権を争っており、その結果、ADA 市場は比較的安定しています。 ADAの価格は過去1週間で6%以上急騰しており、強気派が戦いに勝利しているようだ。このトークンは現在0.3862ドルで取引されており、24時間で1.82%上昇した。 ADAの取引高も増加しており、今後数日間で価値が急騰する可能性があることを示しています。
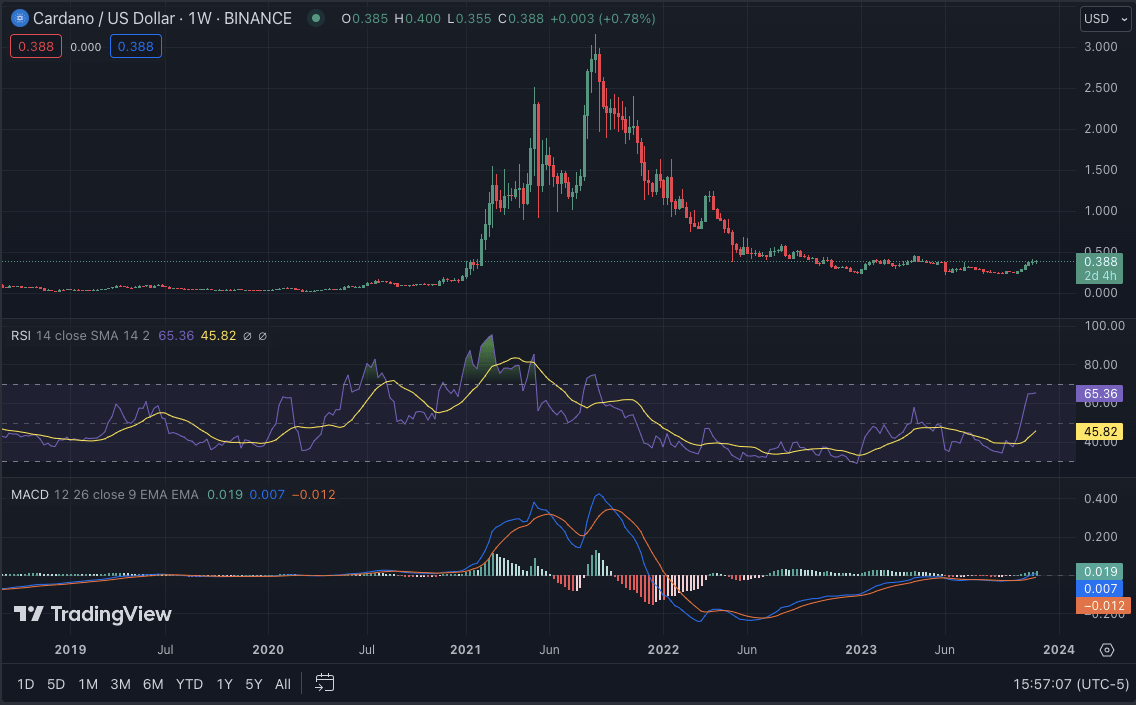
ADA/USD weekly chart, source: TradingView
ADA/USD週足チャート、出典:TradingView
The technical indicators for ADA show a potential bullish trend in the near future. The RSI is currently above 60, indicating strong buying pressure from investors. The MACD histogram also shows signs of a bullish trend, while the moving averages indicate buy signals. If bulls continue to dominate, ADA could reach its next resistance level at $0.4000. On the other hand, if bears take over, ADA’s price could drop to its support level of $0.03500.
ADA のテクニカル指標は、近い将来に強気傾向になる可能性を示しています。 RSIは現在60を超えており、投資家からの買い圧力が強いことを示している。 MACD ヒストグラムも強気トレンドの兆候を示しており、移動平均は買いシグナルを示しています。強気派が優勢を続ければ、ADAは次の抵抗線である0.4000ドルに到達する可能性がある。一方、弱気派が相場を引き継いだ場合、ADA価格はサポートレベルの0.03500ドルまで下落する可能性がある。
DOGE/USD
ドージ/米ドル
DOGE has been trading sideways for most of the week, fluctuating prices between $0.0700 and $0.08000. However, towards the end of the week, DOGE saw a slight dip in its price, reaching $0.19 before recovering to its current trading price of $0.07155. Over the past seven days, DOGE has seen a 7% decrease in value. At the time of writing, DOGE/USD is trading at $0.07735, with a slight increase of 1.90% in the past 24 hours.
DOGEは今週のほとんどの期間横ばいで取引されており、価格は0.0700ドルから0.08000ドルの間で変動している。しかし、週末にかけてDOGEの価格はわずかに下落し、0.19ドルに達し、その後現在の取引価格0.07155ドルに回復しました。過去 7 日間で、DOGE の価値は 7% 下落しました。この記事の執筆時点では、DOGE/USD は 0.07735 ドルで取引されており、過去 24 時間で 1.90% わずかに上昇しました。
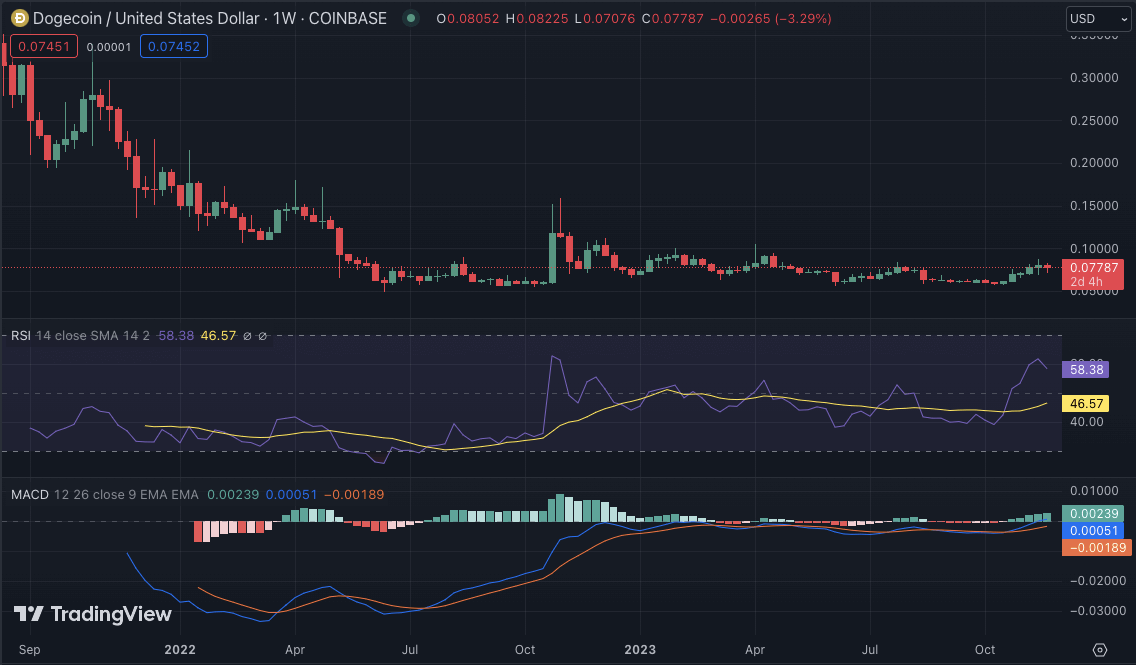
DOGE/USD weekly chart, Source: TradingView
DOGE/USD週足チャート、出典:TradingView
The technical indicators for DOGE show a possible continuation of the bearish trend in the coming days. The RSI is currently below 60, indicating neutral sentiment in the market, and if it continues to drop, it could indicate a further downward trend for DOGE. The MACD also shows signs of a bearish crossover, and the 50-SMA is below the 200-SMA, confirming a negative outlook for DOGE.
DOGE のテクニカル指標は、今後数日間弱気傾向が継続する可能性を示しています。 RSIは現在60を下回っており、市場の中立的なセンチメントを示しており、このまま低下し続ければ、DOGEのさらなる下降傾向を示す可能性がある。 MACD も弱気クロスオーバーの兆候を示しており、50-SMA は 200-SMA を下回っており、DOGE の見通しがネガティブであることが確認されています。
Conclusion
結論
In conclusion, the weekly crypto price analysis shows a mixed sentiment in the market for major cryptocurrencies. The bulls and bears struggle for control, resulting in a relatively stable market. However, technical indicators show potential bullish or bearish trends for each token, depending on market sentiment and the direction of major cryptocurrencies such as Bitcoin and Ethereum. In the coming week, it will be interesting to see if the bulls or bears gain dominance and how it will affect the price movements of these cryptocurrencies.
結論として、毎週の仮想通貨価格分析は、主要な仮想通貨に対する市場のセンチメントが複雑であることを示しています。強気派と弱気派が主導権を争うため、市場は比較的安定している。ただし、テクニカル指標は、市場センチメントやビットコインやイーサリアムなどの主要な暗号通貨の方向に応じて、各トークンの潜在的な強気または弱気の傾向を示します。来週、強気派か弱気派が優位性を獲得し、それがこれらの暗号通貨の価格変動にどのような影響を与えるかを見るのは興味深いでしょう。
 TheNewsCrypto
 CFN
CFN DogeHome
 Optimisus
 Crypto News Land
 Optimisus
 Cryptopolitan_News


