

In the most recent week, the cryptocurrency market has seen a mix of bullish and bearish trends, with most cryptocurrencies trading in neutral ranges. The weekly crypto price analysis reveals a market has been struggling to find direction, with most of the tokens seeing gains rather than losses. The market has been volatile, and buying and selling opportunities abound.
最近一周,加密貨幣市場出現了看漲和看跌趨勢的混合,大多數加密貨幣的交易價格處於中性區間。每週的加密貨幣價格分析顯示,市場一直在努力尋找方向,大多數代幣都在上漲而不是下跌。市場一直在波動,買賣機會比比皆是。
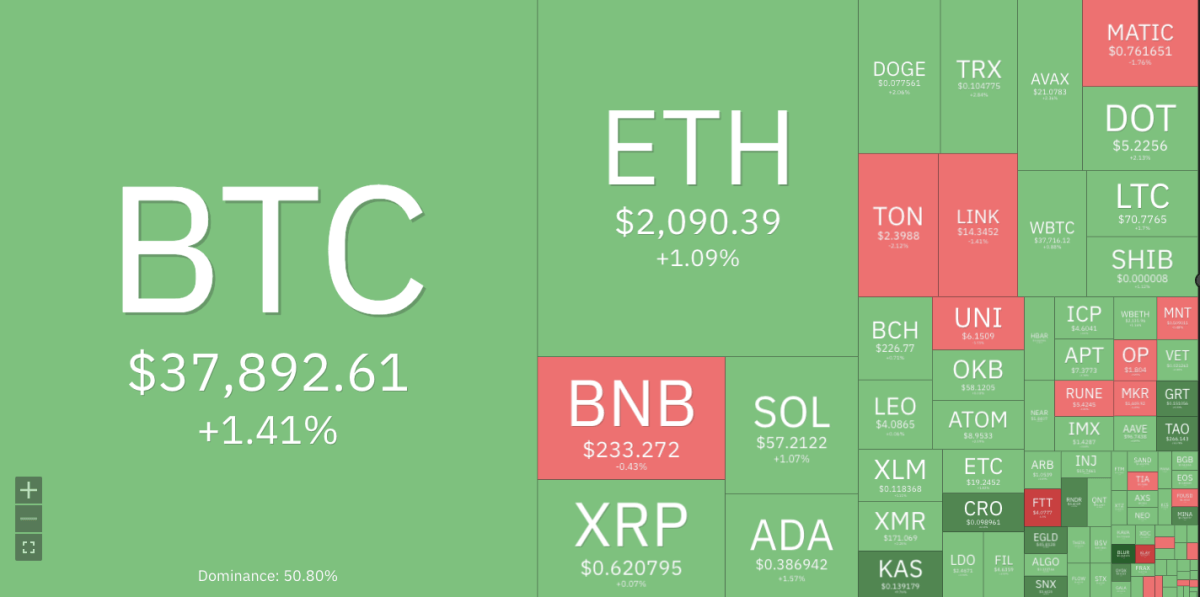
Cryptocurrencies Price Heatmap, Source: Coin360
加密貨幣價格熱圖,來源:Coin360
The leading cryptocurrency, Bitcoin (BTC), has managed to hold its position above $37k after a bullish outlook in the past week. The ETH price has also been showing bullish signs, with the token trading above $2k. Additionally, the XRP and ADA prices have gained momentum, with both tokens seeing a significant increase in value. However, not all cryptocurrencies have been on an upward trajectory. BNB’s price has been relatively stable after a bearish outlook, while Dogecoin (DOGE) and Solana (SOL) are experiencing a slight downward trend.
在過去一周看漲前景之後,領先的加密貨幣比特幣 (BTC) 已成功保持在 3.7 萬美元以上。 ETH 價格也顯示出看漲跡象,代幣交易價格超過 2000 美元。此外,XRP 和 ADA 價格上漲勢頭強勁,兩種代幣的價值均大幅上漲。然而,並非所有加密貨幣都處於上升軌道。在經歷了看跌前景之後,BNB 的價格相對穩定,而狗狗幣 (DOGE) 和 Solana (SOL) 則呈現小幅下跌趨勢。
BTC/USD
比特幣/美元
BTC started the week on a positive note, with its price rising above $36K. The bullish trend continued throughout the week, and the token’s price reached $37k before showing signs of consolidation. The BTC dominance percentage has been around 50%, indicating a strong hold on the market.
BTC 本週開局積極,價格升至 3.6 萬美元以上。看漲趨勢持續整週,代幣價格達到 3.7 萬美元,然後出現盤整跡象。 BTC 的主導地位一直在 50% 左右,顯示其對市場的掌控力很強。
BTC/USD is currently trading at $37,892, with a 24-hour surge of 1.41% and a seven-day increase of 3.48%. If bullish momentum continues, BTC’s price will reach its next resistance level at $40k. However, if bears take control, BTC’s price could drop to its support level of $35k.
BTC/美元目前交易價格為37,892美元,24小時漲幅1.41%,7天漲幅3.48%。如果看漲勢頭持續,BTC 的價格將達到下一個阻力位 4 萬美元。然而,如果空頭佔據主導地位,比特幣的價格可能會跌至 3.5 萬美元的支撐位。
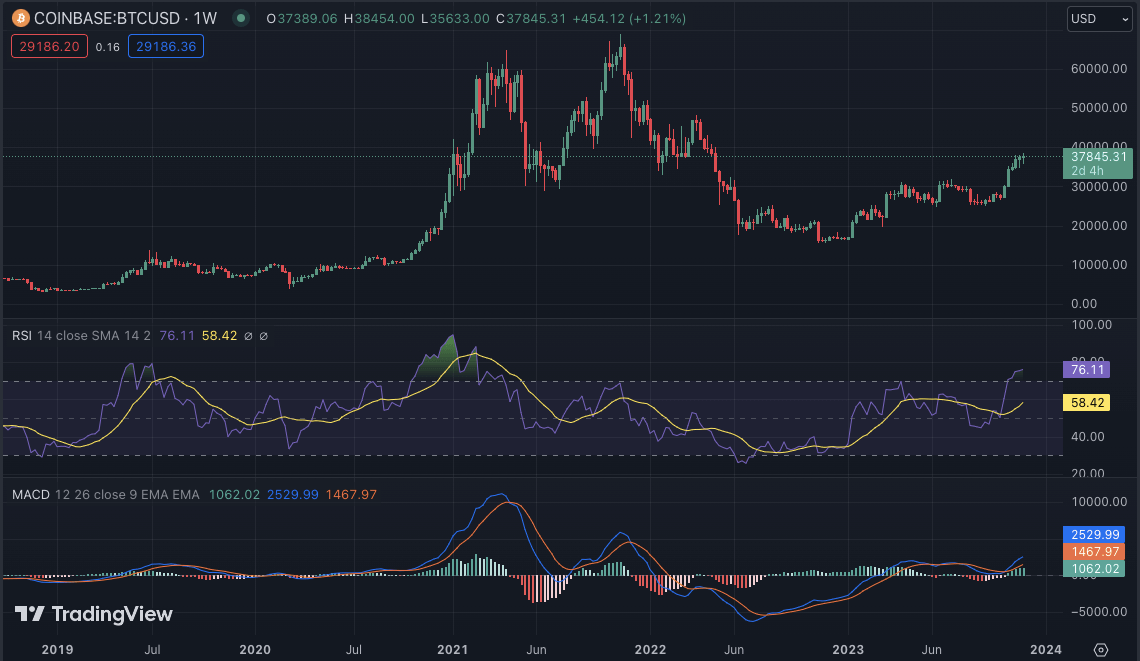
BTC/USD weekly chart, source: TradingView
BTC/美元週線圖,資料來源:TradingView
The weekly technical indicators are indicating a possible bullish momentum for BTC. The MACD (Moving Average Convergence Divergence) histogram shows an upward trend, and the RSI (Relative Strength Index) is above 70, indicating a buying sentiment in the market. The 20-EMA and 50-EMA also show bullish crossovers, confirming a positive BTC outlook.
每週技術指標顯示比特幣可能出現看漲勢頭。 MACD(移動平均線趨同散度)長條圖呈上升趨勢,RSI(相對強弱指數)位於70以上,顯示市場有買盤情緒。 20 EMA 和 50 EMA 也顯示出看漲交叉,證實了 BTC 的積極前景。
ETH/USD
以太坊/美元
ETH has been showing a bullish outlook, with its price breaking above the $2k mark multiple times in the past week. The token reached a weekly high of $2,123 but was met with resistance and consolidated around the $2,1k level. ETH token has been hovering between $2k and 2,1k, with bullish and bearish forces struggling for control. At the time of writing, ETH is trading at $2,090, with a seven-day strong surge of 7%.
ETH 一直表現出看漲的前景,其價格在過去一周多次突破 2000 美元大關。該代幣觸及 2,123 美元的周高點,但遇到阻力並在 2,100 美元附近盤整。 ETH 代幣一直徘徊在 2,100 美元到 2,100 美元之間,看漲和看跌力量爭奪控制權。截至撰寫本文時,ETH 交易價格為 2,090 美元,連續 7 天強勁飆升 7%。
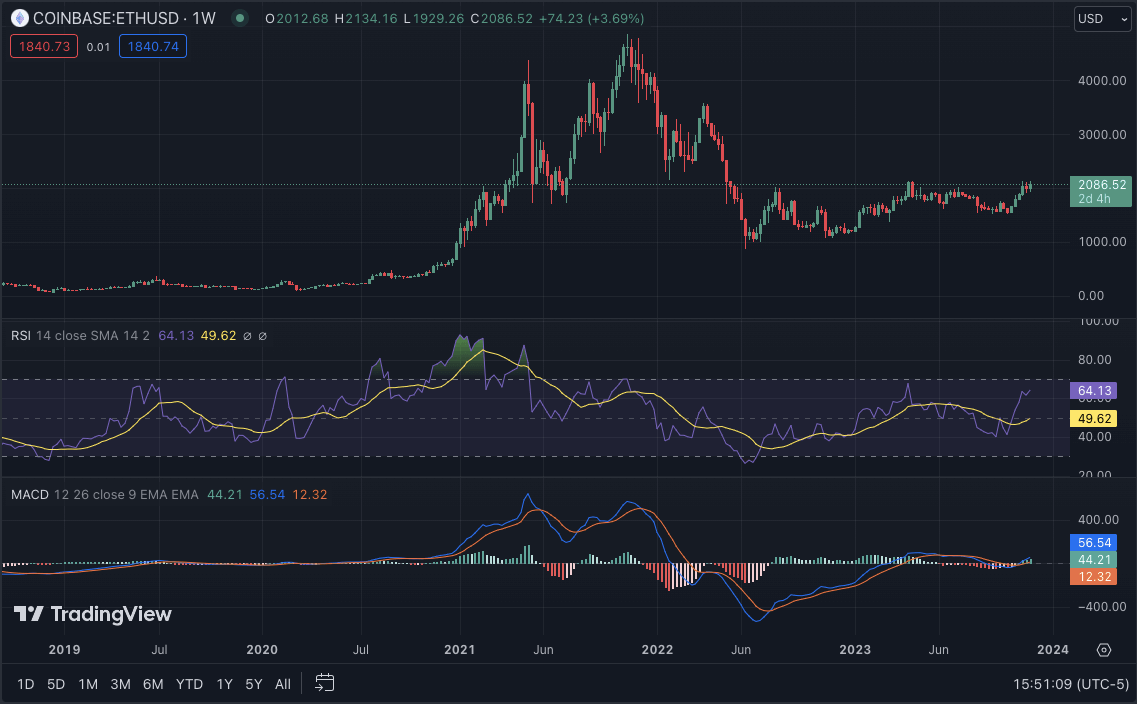
ETH/USD weekly chart, source: TradingView
ETH/美元週線圖,來源:TradingView
ETH/USD has strong support at $2k, with a resistance level of $2.1k. If bulls dominate the market, ETH’s price could break above its current resistance and reach $2,200. On the other hand, if bears take over, ETH’s price could drop to its support level of $1,900.
ETH/USD 的強勁支撐位為 2,000 美元,阻力位為 2,100 美元。如果多頭主導市場,ETH 的價格可能會突破當前阻力位並達到 2,200 美元。另一方面,如果空頭接管,ETH 的價格可能會跌至 1,900 美元的支撐位。
The 50-SMA and 200-SMA on the weekly chart show a potential bullish crossover, indicating a positive outlook for ETH. The moving average convergence/divergence (MACD) also shows a bullish trend, while the relative strength index (RSI) is above 60, indicating strong buying pressure in the market. The moving averages are indicating buy signals, supporting the overall bullish sentiment.
週線圖上的 50-SMA 和 200-SM 顯示潛在的看漲交叉,顯示 ETH 前景樂觀。平滑異同移動平均線(MACD)也呈現看漲趨勢,而相對強弱指數(RSI)則在60以上,顯示市場買盤壓力強勁。移動平均線顯示買進訊號,支撐整體看漲情緒。
BNB/USD
幣安幣/美元
BNB has been trading in a tight range, with its price hovering between $300 and $320. The token saw a slight downward trend in the past week, reaching a low of $286 before bouncing back to its current price of $230 levels. The bulls and bears have been struggling for control, resulting in a relatively stable market for BNB. Currently, BNB is trading at $233, with a weekly dip of 4.46%.
BNB 一直窄幅波動,價格徘徊在 300 美元至 320 美元之間。該代幣在過去一周出現小幅下跌趨勢,觸及 286 美元的低點,然後反彈至目前 230 美元的價格水平。多頭和空頭一直在爭奪控制權,導致BNB市場相對穩定。目前,BNB 交易價格為 233 美元,週跌幅為 4.46%。
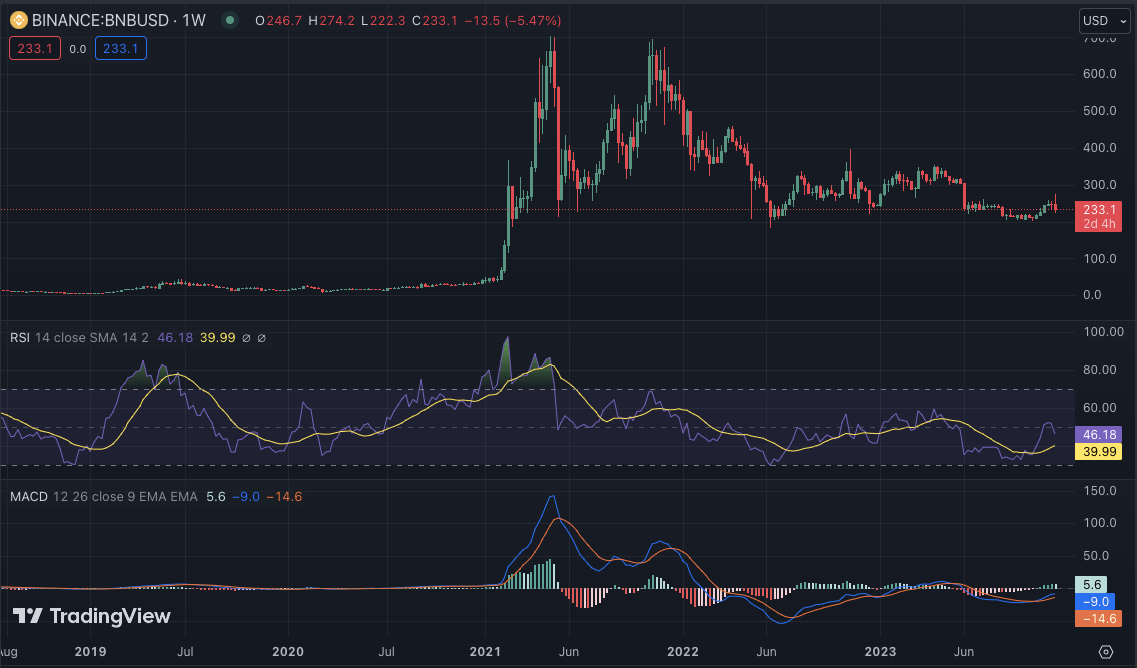
BNB/USD weekly chart, source: TradingView
BNB/美元週線圖,來源:TradingView
The technical indicators for BNB show a potential bearish trend in the near future. The RSI is currently below 50, indicating a selling sentiment and the MACD histogram shows signs of a bearish crossover. The MACD line is also below the signal line, confirming a negative outlook for BNB. The 100-SMA and 200-SMA also show a bearish crossover, indicating a possible further downward trend for BNB.
BNB的技術指標顯示出近期潛在的看跌趨勢。 RSI 目前低於 50,顯示拋售情緒,MACD 長條圖顯示看跌交叉跡象。 MACD 線也位於訊號線下方,證實了 BNB 的負面前景。 100-SMA 和 200-SM 也顯示出看跌交叉,顯示 BNB 可能有進一步下跌的趨勢。
XRP/USD
瑞波幣/美元
XRP saw a significant surge in its price this week, reaching a weekly high of $0.628 before consolidating around the $0.61 level. The token’s bullish momentum has been driven by positive market sentiment and recent partnerships. XRP token has been rallying above its previous resistance level of $0.60, indicating a strong surge in value. XRP is currently trading at $0.6270 level, with a weekly increase of 2%.
XRP 價格本周大幅上漲,達到 0.628 美元的周高點,然後在 0.61 美元的水平附近盤整。該代幣的看漲勢頭是由積極的市場情緒和最近的合作夥伴關係推動的。 XRP 代幣一直反彈至先前 0.60 美元的阻力位上方,顯示其價值強勁飆升。 XRP 目前交易價格為 0.6270 美元,週漲幅為 2%。
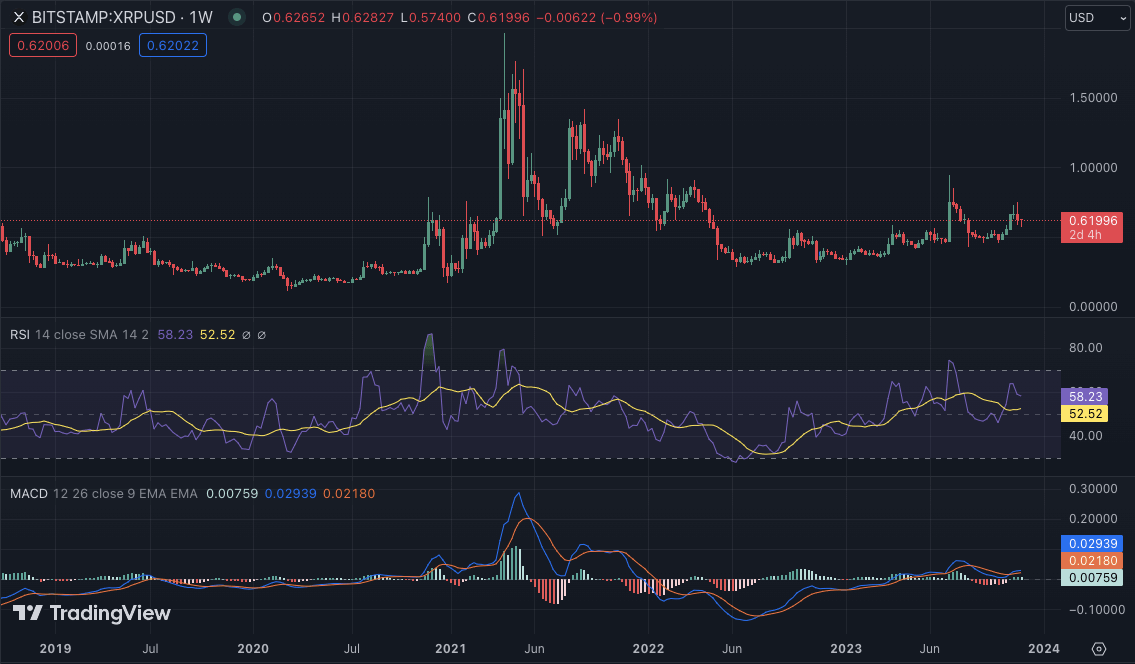
XRP/USD weekly chart, source: TradingView
XRP/美元週線圖,來源:TradingView
XRP/USD has strong support at $0.58, with its next resistance level at $0.6300. If bulls continue to dominate the market, XRP’s price could reach its next resistance level at $0.6500. However, if bears take control, XRP’s price could drop to its support level of $0.58.
XRP/USD 的強勁支撐位為 0.58 美元,下一個阻力位為 0.6300 美元。如果多頭繼續主導市場,XRP 的價格可能會達到下一個阻力位 0.6500 美元。然而,如果空頭佔據主導地位,XRP 的價格可能會跌至 0.58 美元的支撐位。
The technical indicators for XRP show a potential bullish trend in the near future. The RSI is currently above 50, indicating bulls are more dominant in the market. The MACD histogram also shows a bullish trend and the 50-SMA and 100-SMA show signs of a potential bullish crossover.
XRP 的技術指標顯示出近期潛在的看漲趨勢。目前RSI高於50,顯示多頭在市場上更具主導地位。 MACD柱狀圖也顯示出看漲趨勢,50-SMA和100-SMA顯示出潛在看漲交叉的跡象。
SOL/USD
索爾/美元
Weekly crypto price analysis also reveals that Solana (SOL) has been trading in a downward trend. The token saw a significant drop in its price from $62 to $57 before bouncing back to its current level of $57.10. SOL’s bearish movement is attributed to overall market sentiment and profit-taking by investors. SOL has seen a weekly dip of 1.8%, with its value fluctuating within a tight range.
每週加密貨幣價格分析也顯示 Solana (SOL) 一直處於下跌趨勢。該代幣的價格從 62 美元大幅下跌至 57 美元,然後反彈至目前的 57.10 美元水準。 SOL 的看跌走勢歸因於整體市場情緒和投資者的獲利了結。 SOL 週跌幅為 1.8%,價值窄幅波動。
SOL/USD has a strong support level of $30 and a resistance level of $35. If bulls take control, SOL’s price could reach its next resistance level at $40. However, if bears continue to dominate, SOL’s price could drop to its support level of $25. However, today, it saw a surge of 1.24%, giving hope to the bullish investors.
SOL/USD 的強勁支撐位為 30 美元,阻力位為 35 美元。如果多頭佔據主導地位,SOL 的價格可能會達到下一個阻力位 40 美元。然而,如果空頭繼續佔據主導地位,SOL 的價格可能會跌至 25 美元的支撐位。然而,今天它卻飆升了1.24%,為看漲的投資者帶來了希望。
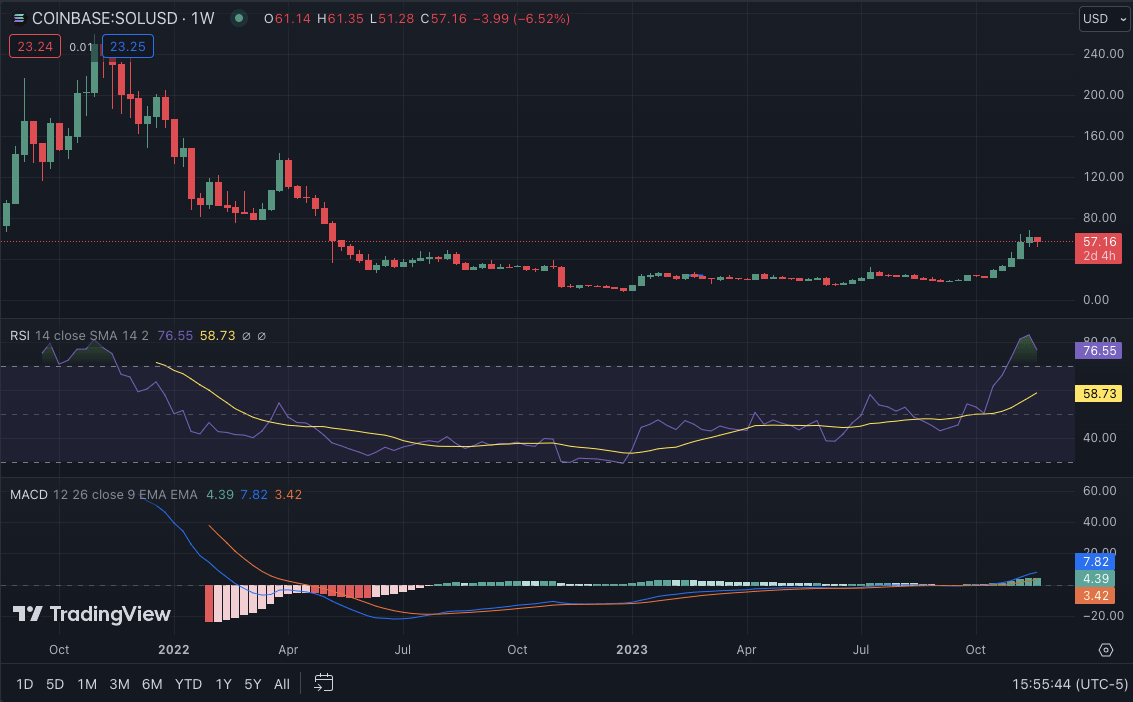
SOL/USD weekly chart, source: TradingView
SOL/USD 週線圖,來源:TradingView
The technical indicators for SOL show mixed signals, with the RSI below 80 but showing signs of an upward trend. The MACD histogram shows a possible bullish crossover, while the moving averages indicate a buy signal. Overall, SOL’s price movement will depend on market sentiment and the direction of major cryptocurrencies. The 20-EMA and 50-EMA show bullish crossovers, indicating a possible upward movement for SOL in the near future.
SOL 的技術指標顯示出好壞參半的訊號,RSI 低於 80,但顯示出上升趨勢的跡象。 MACD 長條圖顯示可能出現看漲交叉,而移動平均線則顯示買入訊號。整體而言,SOL 的價格走勢將取決於市場情緒和主要加密貨幣的方向。 20 EMA 和 50 EMA 顯示看漲交叉,表明 SOL 在不久的將來可能會上漲。
ADA/USD
艾達/美元
Looking at the DOGE weekly price analysis, bulls and bears have been fighting for control, resulting in a relatively stable market for ADA. The bulls seem to be winning the battle, with ADA’s price surging by more than 6% in the past week. The token currently trades at $0.3862, with a 24-hour increase of 1.82%. The trading volume for ADA has also increased, indicating a possible surge in value in the coming days.
從DOGE每週價格分析來看,多頭和空頭一直在爭奪控制權,導致ADA市場相對穩定。多頭似乎正在贏得這場戰鬥,ADA 的價格在過去一周飆升了 6% 以上。該代幣目前交易價格為0.3862美元,24小時漲幅為1.82%。 ADA 的交易量也有所增加,顯示未來幾天其價值可能會飆升。
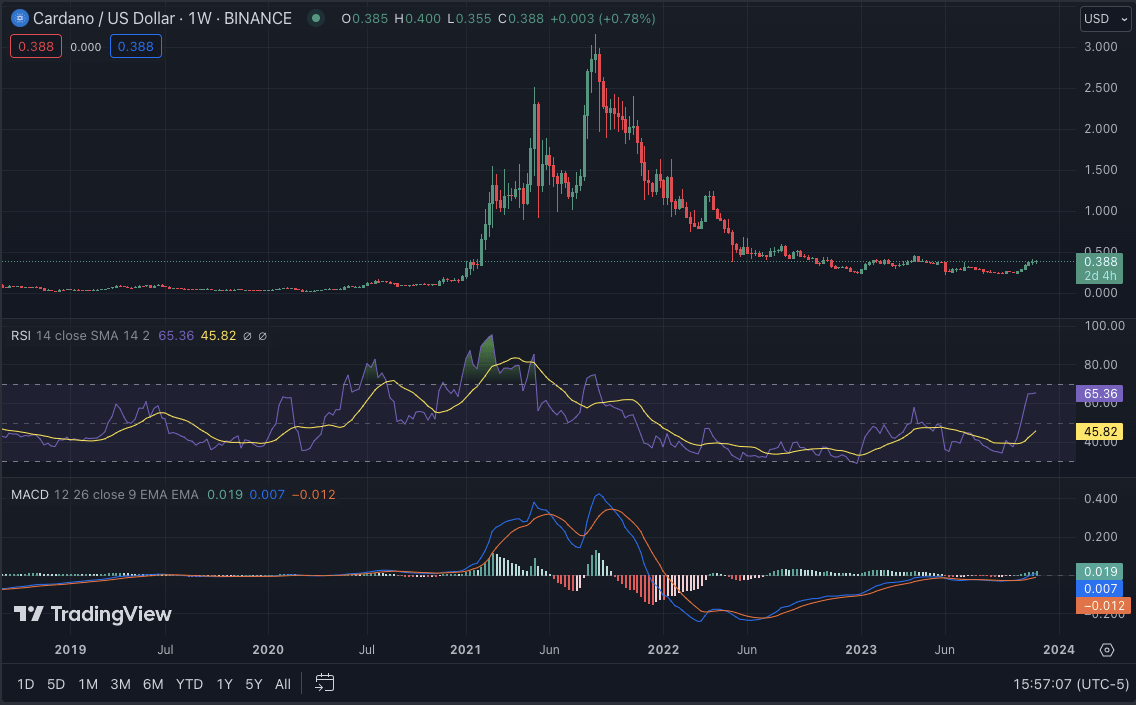
ADA/USD weekly chart, source: TradingView
ADA/美元週線圖,來源:TradingView
The technical indicators for ADA show a potential bullish trend in the near future. The RSI is currently above 60, indicating strong buying pressure from investors. The MACD histogram also shows signs of a bullish trend, while the moving averages indicate buy signals. If bulls continue to dominate, ADA could reach its next resistance level at $0.4000. On the other hand, if bears take over, ADA’s price could drop to its support level of $0.03500.
ADA 的技術指標顯示出近期潛在的看漲趨勢。目前RSI高於60,顯示投資人的買盤壓力較大。 MACD 長條圖也顯示看漲趨勢的跡象,而移動平均線則顯示買入訊號。如果多頭繼續佔據主導地位,ADA 可能會觸及下一個阻力位 0.4000 美元。另一方面,如果空頭接管,ADA 的價格可能會跌至 0.03500 美元的支撐位。
DOGE/USD
狗狗幣/美元
DOGE has been trading sideways for most of the week, fluctuating prices between $0.0700 and $0.08000. However, towards the end of the week, DOGE saw a slight dip in its price, reaching $0.19 before recovering to its current trading price of $0.07155. Over the past seven days, DOGE has seen a 7% decrease in value. At the time of writing, DOGE/USD is trading at $0.07735, with a slight increase of 1.90% in the past 24 hours.
DOGE 本週大部分時間都在橫盤整理,價格在 0.0700 美元至 0.08000 美元之間波動。然而,到了週末,DOGE 的價格小幅下跌,達到 0.19 美元,然後恢復到目前的交易價格 0.07155 美元。在過去 7 天裡,DOGE 的價值下跌了 7%。截至撰寫本文時,DOGE/USD 交易價格為 0.07735 美元,在過去 24 小時內小幅上漲 1.90%。
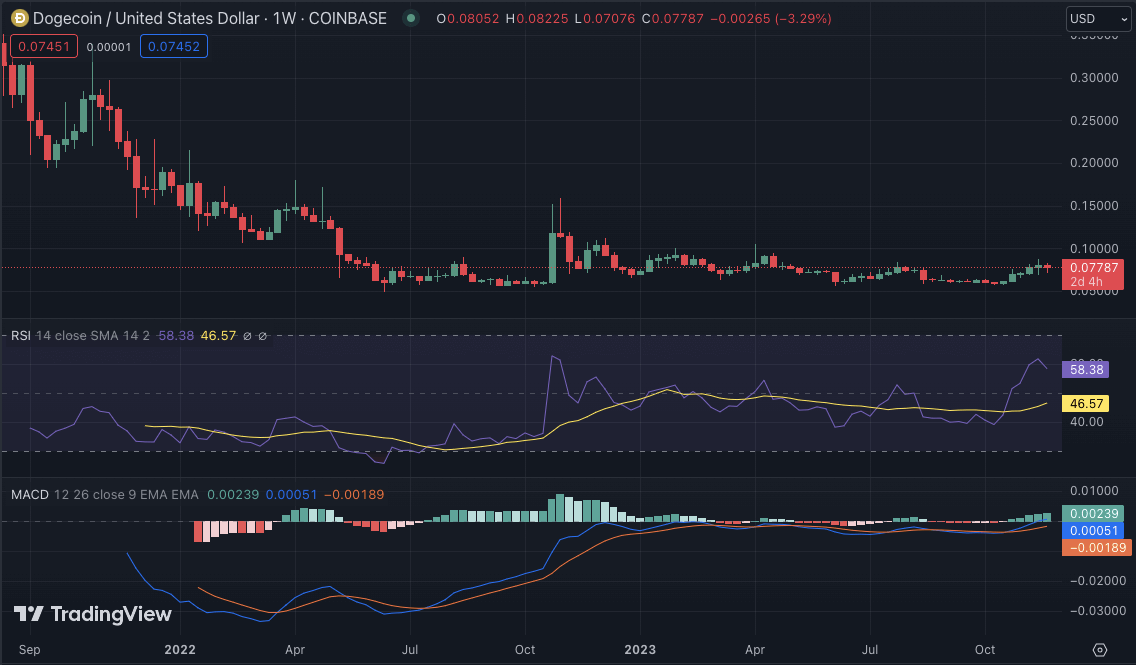
DOGE/USD weekly chart, Source: TradingView
DOGE/美元週線圖,來源:TradingView
The technical indicators for DOGE show a possible continuation of the bearish trend in the coming days. The RSI is currently below 60, indicating neutral sentiment in the market, and if it continues to drop, it could indicate a further downward trend for DOGE. The MACD also shows signs of a bearish crossover, and the 50-SMA is below the 200-SMA, confirming a negative outlook for DOGE.
DOGE 的技術指標顯示未來幾天看跌趨勢可能會持續。 RSI目前低於60,顯示市場情緒中性,如果繼續下跌,可能表示DOGE有進一步下跌的趨勢。 MACD 也顯示出看跌交叉的跡象,50 移動平均線低於 200 移動平均線,證實了 DOGE 的負面前景。
Conclusion
結論
In conclusion, the weekly crypto price analysis shows a mixed sentiment in the market for major cryptocurrencies. The bulls and bears struggle for control, resulting in a relatively stable market. However, technical indicators show potential bullish or bearish trends for each token, depending on market sentiment and the direction of major cryptocurrencies such as Bitcoin and Ethereum. In the coming week, it will be interesting to see if the bulls or bears gain dominance and how it will affect the price movements of these cryptocurrencies.
總之,每週的加密貨幣價格分析顯示市場對主要加密貨幣的情緒好壞參半。多頭和空頭爭奪控制權,導致市場相對穩定。然而,技術指標顯示每種代幣的潛在看漲或看跌趨勢,取決於市場情緒以及比特幣和以太幣等主要加密貨幣的方向。在接下來的一周,看看多頭或空頭是否佔據主導地位以及它將如何影響這些加密貨幣的價格走勢將會很有趣。
 CoinoMedia
 Optimisus
 CFN
CFN CFN
CFN The Crypto Times
 Cryptopolitan_News
 Crypto News Land
 CryptoNewsLand
 CoinPedia News


