

In the most recent week, the cryptocurrency market has seen a mix of bullish and bearish trends, with most cryptocurrencies trading in neutral ranges. The weekly crypto price analysis reveals a market has been struggling to find direction, with most of the tokens seeing gains rather than losses. The market has been volatile, and buying and selling opportunities abound.
가장 최근 주에 암호화폐 시장은 강세와 약세 추세가 혼합된 모습을 보였으며 대부분의 암호화폐는 중립 범위에서 거래되었습니다. 주간 암호화폐 가격 분석에 따르면 대부분의 토큰은 손실보다는 이익을 보였으며 시장은 방향을 찾기 위해 고군분투하고 있는 것으로 나타났습니다. 시장은 변동성이 심해 매수 및 매도 기회가 풍부합니다.
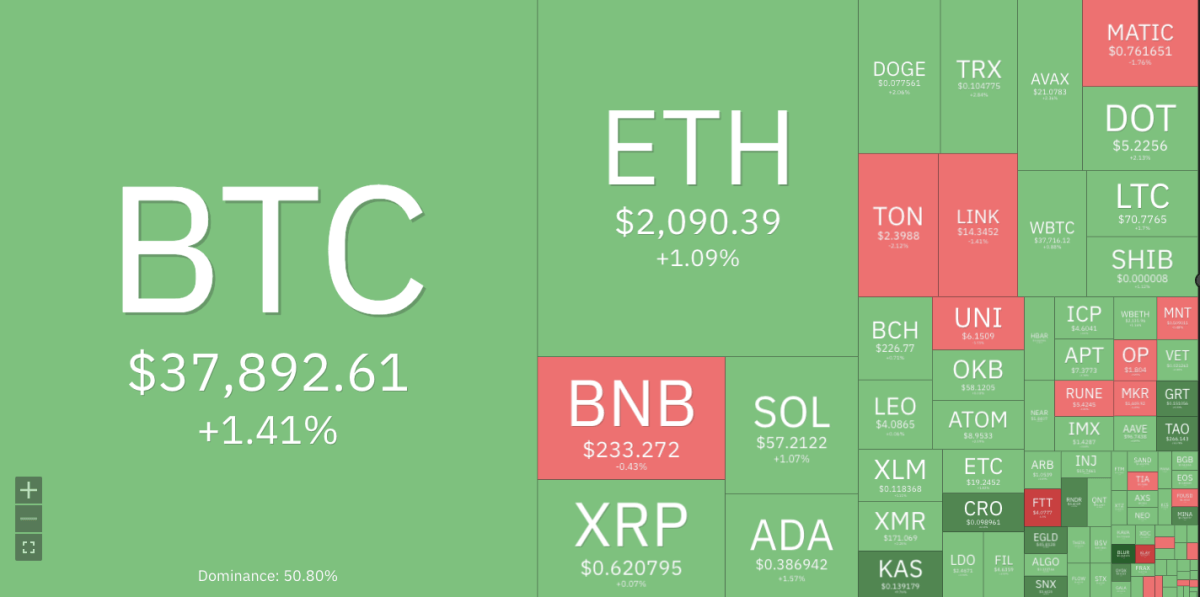
Cryptocurrencies Price Heatmap, Source: Coin360
The leading cryptocurrency, Bitcoin (BTC), has managed to hold its position above $37k after a bullish outlook in the past week. The ETH price has also been showing bullish signs, with the token trading above $2k. Additionally, the XRP and ADA prices have gained momentum, with both tokens seeing a significant increase in value. However, not all cryptocurrencies have been on an upward trajectory. BNB’s price has been relatively stable after a bearish outlook, while Dogecoin (DOGE) and Solana (SOL) are experiencing a slight downward trend.
선도적인 암호화폐인 비트코인(BTC)은 지난 주 낙관적인 전망 이후 37,000달러 이상의 위치를 유지했습니다. ETH 가격도 토큰 거래가 2,000달러 이상으로 상승하는 등 강세를 보이고 있습니다. 또한 XRP와 ADA 가격은 탄력을 받아 두 토큰 모두 가치가 크게 상승했습니다. 그러나 모든 암호화폐가 상승 궤도에 있었던 것은 아닙니다. BNB의 가격은 약세 전망 이후 상대적으로 안정세를 유지하고 있는 반면, 도지코인(DOGE)과 솔라나(SOL)는 소폭 하락세를 보이고 있습니다.
BTC/USD
BTC/USD
BTC started the week on a positive note, with its price rising above $36K. The bullish trend continued throughout the week, and the token’s price reached $37k before showing signs of consolidation. The BTC dominance percentage has been around 50%, indicating a strong hold on the market.
BTC/USD is currently trading at $37,892, with a 24-hour surge of 1.41% and a seven-day increase of 3.48%. If bullish momentum continues, BTC’s price will reach its next resistance level at $40k. However, if bears take control, BTC’s price could drop to its support level of $35k.
BTC/USD는 현재 37,892달러에 거래되고 있으며, 24시간 상승폭은 1.41%, 7일간 상승폭은 3.48%입니다. 강세 모멘텀이 계속된다면 BTC 가격은 $40,000의 다음 저항 수준에 도달할 것입니다. 그러나 곰이 장악하면 BTC 가격은 지원 수준인 35,000달러까지 떨어질 수 있습니다.
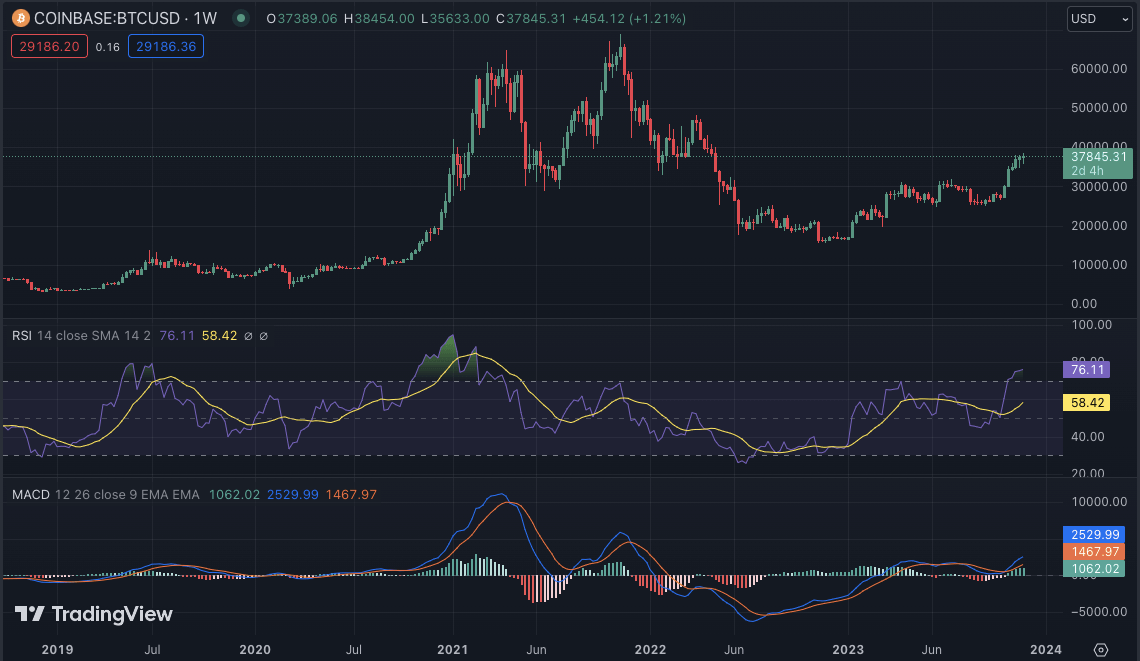
BTC/USD weekly chart, source: TradingView
The weekly technical indicators are indicating a possible bullish momentum for BTC. The MACD (Moving Average Convergence Divergence) histogram shows an upward trend, and the RSI (Relative Strength Index) is above 70, indicating a buying sentiment in the market. The 20-EMA and 50-EMA also show bullish crossovers, confirming a positive BTC outlook.
주간 기술 지표는 BTC의 강세 모멘텀을 나타내고 있습니다. MACD(Moving Average Convergence Divergence) 히스토그램은 상승 추세를 보이고 있으며, RSI(Relative Strength Index)는 70을 넘어 시장의 매수 심리를 나타냅니다. 20-EMA와 50-EMA도 강세 교차를 보여 긍정적인 BTC 전망을 확인시켜줍니다.
ETH/USD
ETH has been showing a bullish outlook, with its price breaking above the $2k mark multiple times in the past week. The token reached a weekly high of $2,123 but was met with resistance and consolidated around the $2,1k level. ETH token has been hovering between $2k and 2,1k, with bullish and bearish forces struggling for control. At the time of writing, ETH is trading at $2,090, with a seven-day strong surge of 7%.
ETH는 지난 주에 가격이 2,000달러를 여러 차례 돌파하는 등 낙관적인 전망을 보여왔습니다. 토큰은 주간 최고치인 $2,123에 도달했지만 저항에 부딪혀 $2,1,000 수준으로 통합되었습니다. ETH 토큰은 강세와 약세 세력이 통제를 위해 고군분투하면서 $2,000에서 2,1,000 사이를 맴돌고 있습니다. 이 글을 쓰는 시점에서 ETH는 7일간 7%의 강한 상승세를 보이며 2,090달러에 거래되고 있습니다.
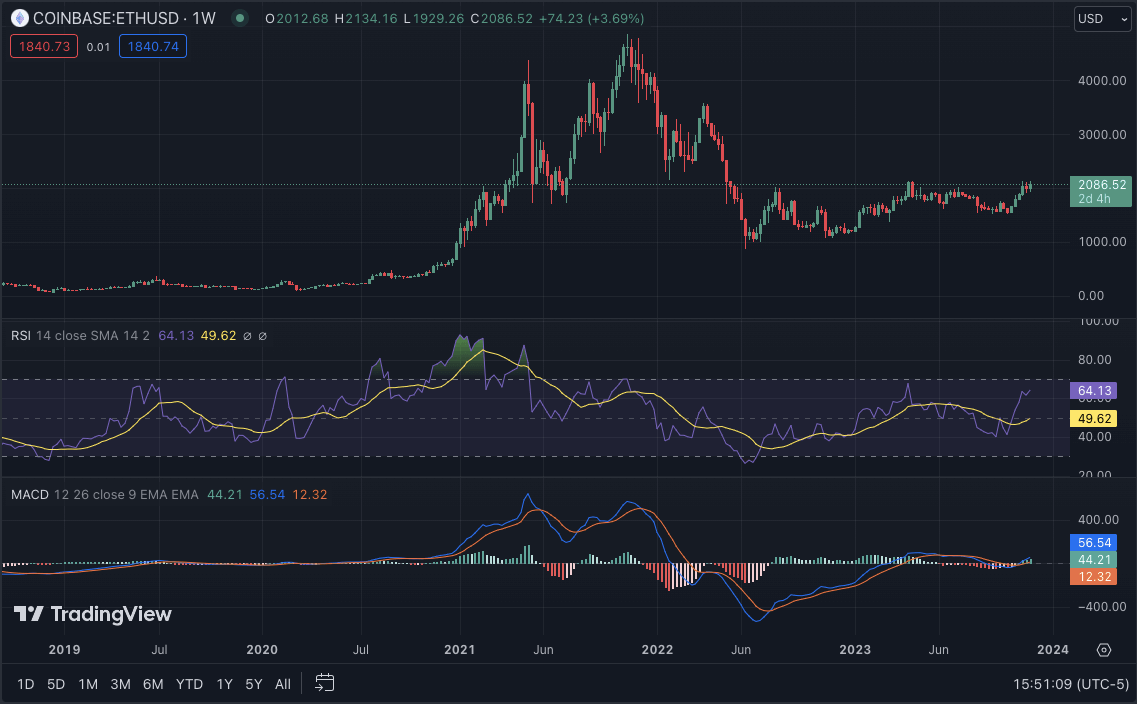
ETH/USD weekly chart, source: TradingView
ETH/USD has strong support at $2k, with a resistance level of $2.1k. If bulls dominate the market, ETH’s price could break above its current resistance and reach $2,200. On the other hand, if bears take over, ETH’s price could drop to its support level of $1,900.
ETH/USD는 $2,000에서 강력한 지지를 받고 있으며 저항 수준은 $2.1,000입니다. 황소가 시장을 지배한다면 ETH의 가격은 현재 저항을 넘어 $2,200에 도달할 수 있습니다. 반면 하락세가 이어지면 ETH 가격은 지원 수준인 1,900달러까지 떨어질 수 있습니다.
The 50-SMA and 200-SMA on the weekly chart show a potential bullish crossover, indicating a positive outlook for ETH. The moving average convergence/divergence (MACD) also shows a bullish trend, while the relative strength index (RSI) is above 60, indicating strong buying pressure in the market. The moving averages are indicating buy signals, supporting the overall bullish sentiment.
주간 차트의 50-SMA와 200-SMA는 잠재적인 강세 교차를 보여 ETH에 대한 긍정적인 전망을 나타냅니다. 이동평균수렴/발산(MACD)도 강세 추세를 보이고 있으며, 상대강도지수(RSI)가 60을 넘어 시장의 강한 매수세를 나타내고 있다. 이동 평균은 매수 신호를 나타내며 전반적인 강세 심리를 뒷받침합니다.
BNB/USD
BNB has been trading in a tight range, with its price hovering between $300 and $320. The token saw a slight downward trend in the past week, reaching a low of $286 before bouncing back to its current price of $230 levels. The bulls and bears have been struggling for control, resulting in a relatively stable market for BNB. Currently, BNB is trading at $233, with a weekly dip of 4.46%.
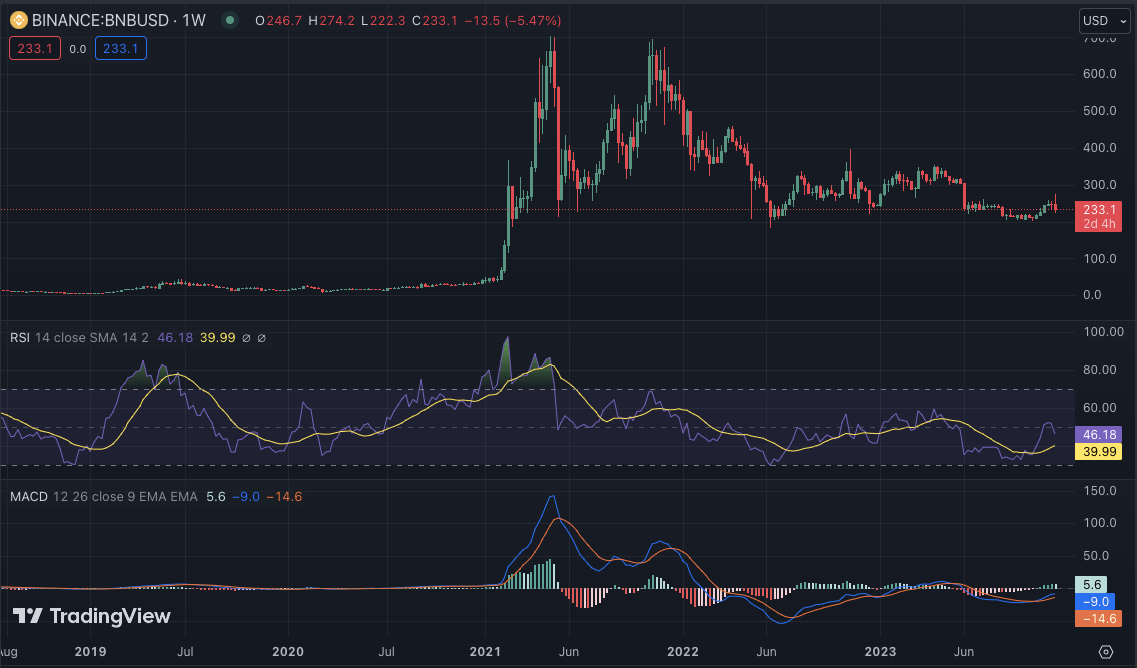
BNB/USD weekly chart, source: TradingView
BNB/USD 주간 차트, 출처: TradingView
The technical indicators for BNB show a potential bearish trend in the near future. The RSI is currently below 50, indicating a selling sentiment and the MACD histogram shows signs of a bearish crossover. The MACD line is also below the signal line, confirming a negative outlook for BNB. The 100-SMA and 200-SMA also show a bearish crossover, indicating a possible further downward trend for BNB.
BNB의 기술 지표는 가까운 미래에 잠재적인 약세 추세를 보여줍니다. RSI는 현재 50 미만으로 매도 심리를 나타내며 MACD 히스토그램은 약세 크로스오버 조짐을 보여줍니다. MACD 라인도 시그널 라인 아래에 있어 BNB에 대한 부정적인 전망을 확인시켜 줍니다. 100-SMA와 200-SMA도 약세 교차를 보여 BNB의 추가 하락 추세가 가능함을 나타냅니다.
XRP/USD
XRP saw a significant surge in its price this week, reaching a weekly high of $0.628 before consolidating around the $0.61 level. The token’s bullish momentum has been driven by positive market sentiment and recent partnerships. XRP token has been rallying above its previous resistance level of $0.60, indicating a strong surge in value. XRP is currently trading at $0.6270 level, with a weekly increase of 2%.
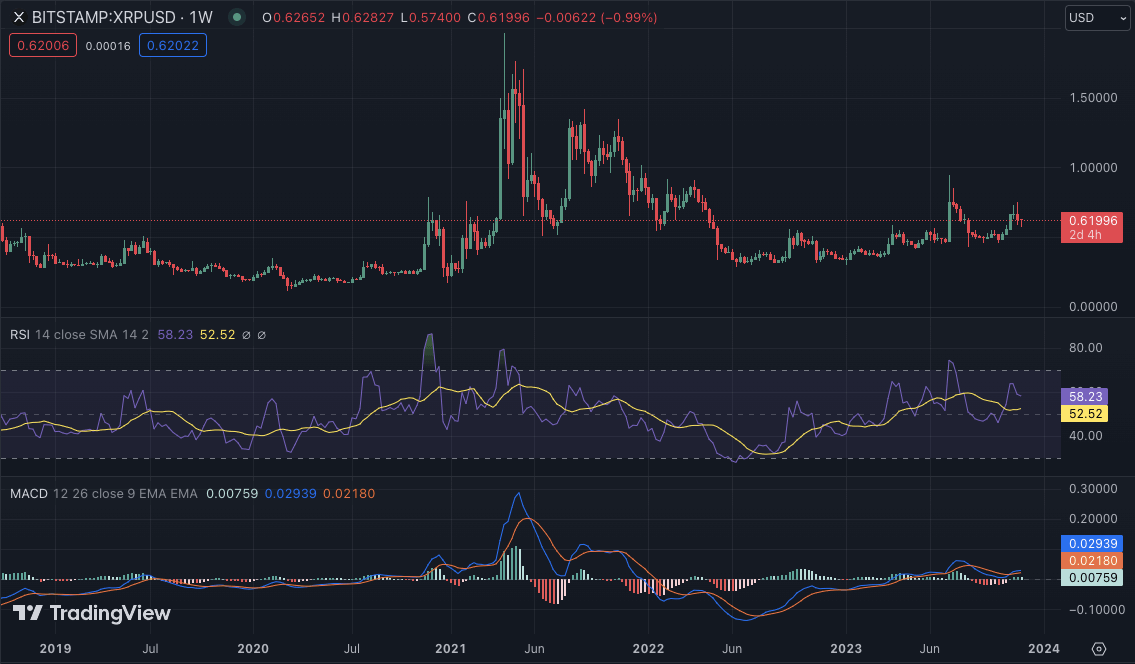
XRP/USD weekly chart, source: TradingView
XRP/USD has strong support at $0.58, with its next resistance level at $0.6300. If bulls continue to dominate the market, XRP’s price could reach its next resistance level at $0.6500. However, if bears take control, XRP’s price could drop to its support level of $0.58.
XRP/USD는 $0.58에서 강력한 지지를 받고 있으며 다음 저항 수준은 $0.6300입니다. 황소가 계속해서 시장을 지배한다면 XRP의 가격은 $0.6500의 다음 저항 수준에 도달할 수 있습니다. 그러나 곰이 통제할 경우 XRP 가격은 지원 수준인 0.58달러까지 떨어질 수 있습니다.
The technical indicators for XRP show a potential bullish trend in the near future. The RSI is currently above 50, indicating bulls are more dominant in the market. The MACD histogram also shows a bullish trend and the 50-SMA and 100-SMA show signs of a potential bullish crossover.
SOL/USD
솔/달러
Weekly crypto price analysis also reveals that Solana (SOL) has been trading in a downward trend. The token saw a significant drop in its price from $62 to $57 before bouncing back to its current level of $57.10. SOL’s bearish movement is attributed to overall market sentiment and profit-taking by investors. SOL has seen a weekly dip of 1.8%, with its value fluctuating within a tight range.
SOL/USD has a strong support level of $30 and a resistance level of $35. If bulls take control, SOL’s price could reach its next resistance level at $40. However, if bears continue to dominate, SOL’s price could drop to its support level of $25. However, today, it saw a surge of 1.24%, giving hope to the bullish investors.
SOL/USD는 $30의 강력한 지지 수준과 $35의 저항 수준을 가지고 있습니다. 상승세가 통제된다면 SOL의 가격은 $40의 다음 저항 수준에 도달할 수 있습니다. 그러나 약세가 계속 지배한다면 SOL의 가격은 지원 수준인 25달러까지 떨어질 수 있습니다. 그러나 오늘은 1.24% 급등하며 낙관적인 투자자들에게 희망을 주고 있습니다.
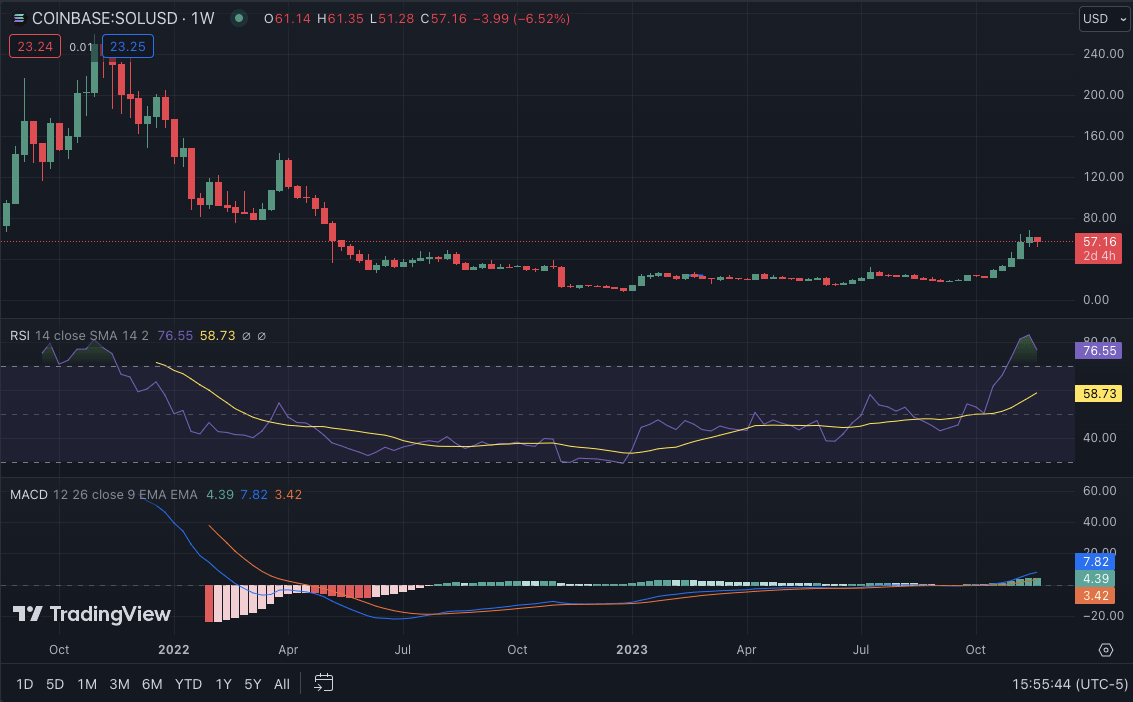
SOL/USD weekly chart, source: TradingView
The technical indicators for SOL show mixed signals, with the RSI below 80 but showing signs of an upward trend. The MACD histogram shows a possible bullish crossover, while the moving averages indicate a buy signal. Overall, SOL’s price movement will depend on market sentiment and the direction of major cryptocurrencies. The 20-EMA and 50-EMA show bullish crossovers, indicating a possible upward movement for SOL in the near future.
SOL의 기술 지표는 RSI가 80 미만이지만 상승 추세의 조짐을 보이는 혼합 신호를 보여줍니다. MACD 히스토그램은 강세 교차 가능성을 보여주고 이동 평균은 매수 신호를 나타냅니다. 전반적으로 SOL의 가격 움직임은 시장 정서와 주요 암호화폐의 방향에 따라 달라집니다. 20-EMA와 50-EMA는 강세 교차를 보여 가까운 시일 내에 SOL의 상승 움직임이 가능함을 나타냅니다.
ADA/USD
Looking at the DOGE weekly price analysis, bulls and bears have been fighting for control, resulting in a relatively stable market for ADA. The bulls seem to be winning the battle, with ADA’s price surging by more than 6% in the past week. The token currently trades at $0.3862, with a 24-hour increase of 1.82%. The trading volume for ADA has also increased, indicating a possible surge in value in the coming days.
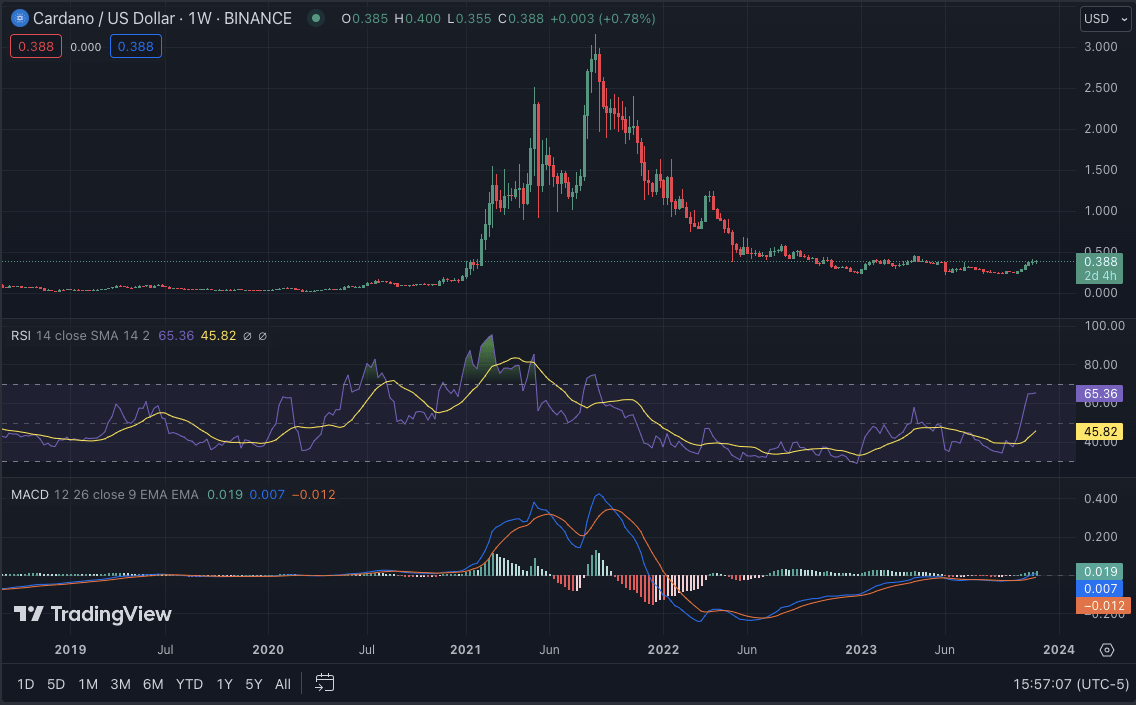
ADA/USD weekly chart, source: TradingView
The technical indicators for ADA show a potential bullish trend in the near future. The RSI is currently above 60, indicating strong buying pressure from investors. The MACD histogram also shows signs of a bullish trend, while the moving averages indicate buy signals. If bulls continue to dominate, ADA could reach its next resistance level at $0.4000. On the other hand, if bears take over, ADA’s price could drop to its support level of $0.03500.
ADA의 기술적 지표는 가까운 미래에 잠재적인 강세 추세를 보여줍니다. RSI는 현재 60을 넘어 투자자들의 강한 매수 압력을 나타냅니다. MACD 히스토그램은 강세 추세의 징후를 보여주고 이동 평균은 매수 신호를 나타냅니다. 황소가 계속해서 지배한다면 ADA는 $0.4000의 다음 저항 수준에 도달할 수 있습니다. 반면 하락세가 이어지면 ADA의 가격은 지원 수준인 $0.03500까지 떨어질 수 있습니다.
DOGE/USD
DOGE has been trading sideways for most of the week, fluctuating prices between $0.0700 and $0.08000. However, towards the end of the week, DOGE saw a slight dip in its price, reaching $0.19 before recovering to its current trading price of $0.07155. Over the past seven days, DOGE has seen a 7% decrease in value. At the time of writing, DOGE/USD is trading at $0.07735, with a slight increase of 1.90% in the past 24 hours.
DOGE는 일주일 내내 $0.0700에서 $0.08000 사이에서 가격이 변동하면서 횡보 거래를 해왔습니다. 그러나 주말에 DOGE는 가격이 소폭 하락하여 $0.19에 도달한 후 현재 거래 가격인 $0.07155로 회복되었습니다. 지난 7일 동안 DOGE의 가치는 7% 하락했습니다. 이 글을 쓰는 시점에서 DOGE/USD는 지난 24시간 동안 1.90% 소폭 상승하여 $0.07735에 거래되고 있습니다.
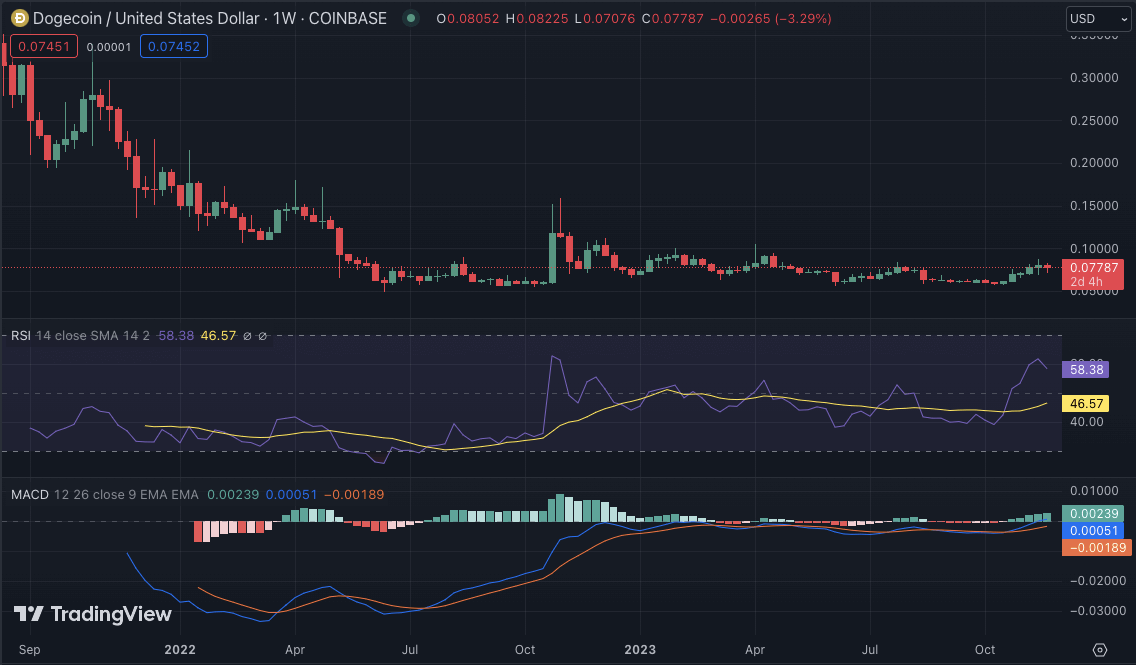
DOGE/USD weekly chart, Source: TradingView
The technical indicators for DOGE show a possible continuation of the bearish trend in the coming days. The RSI is currently below 60, indicating neutral sentiment in the market, and if it continues to drop, it could indicate a further downward trend for DOGE. The MACD also shows signs of a bearish crossover, and the 50-SMA is below the 200-SMA, confirming a negative outlook for DOGE.
DOGE의 기술적 지표는 향후 약세 추세가 지속될 가능성을 보여줍니다. RSI는 현재 60 미만으로 시장의 중립적 분위기를 나타내며, 계속해서 하락할 경우 DOGE의 추가 하락 추세를 나타낼 수 있습니다. MACD도 약세 교차 징후를 보이고 있으며 50-SMA가 200-SMA 아래에 있어 DOGE에 대한 부정적인 전망이 확인되었습니다.
Conclusion
In conclusion, the weekly crypto price analysis shows a mixed sentiment in the market for major cryptocurrencies. The bulls and bears struggle for control, resulting in a relatively stable market. However, technical indicators show potential bullish or bearish trends for each token, depending on market sentiment and the direction of major cryptocurrencies such as Bitcoin and Ethereum. In the coming week, it will be interesting to see if the bulls or bears gain dominance and how it will affect the price movements of these cryptocurrencies.
결론적으로, 주간 암호화폐 가격 분석은 주요 암호화폐 시장에 엇갈린 정서를 보여줍니다. 황소와 곰은 통제를 위해 투쟁하여 상대적으로 안정적인 시장을 형성합니다. 그러나 기술 지표는 시장 정서와 비트코인 및 이더리움과 같은 주요 암호화폐의 방향에 따라 각 토큰에 대한 잠재적인 강세 또는 약세 추세를 보여줍니다. 다음 주에는 강세나 약세가 지배력을 갖게 되는지, 그리고 이것이 암호화폐의 가격 변동에 어떤 영향을 미칠지 지켜보는 것이 흥미로울 것입니다.
 Optimisus
 Crypto News Land
 Optimisus
 Cryptopolitan_News
 DogeHome
 Cryptopolitan
 crypto.ro English


