You can also read this news on COINTURK NEWS: Dogecoin Price Analysis Amidst Market Developments
Sie können diese Nachricht auch auf COINTURK NEWS lesen: Dogecoin-Preisanalyse inmitten der Marktentwicklungen
With the latest developments in the cryptocurrency market, serious price corrections have occurred in the altcoin market. During this period, Bitcoin dominance continued to increase, and especially the growing optimism in spot Bitcoin ETF applications caused investors to turn to Bitcoin. So, what is happening with Dogecoin, the market’s largest memecoin project, during this process? Let’s take a look.
Mit den neuesten Entwicklungen auf dem Kryptowährungsmarkt kam es zu gravierenden Preiskorrekturen auf dem Altcoin-Markt. In diesem Zeitraum nahm die Dominanz von Bitcoin weiter zu, und insbesondere der wachsende Optimismus bei Spot-Bitcoin-ETF-Anwendungen veranlasste Anleger, sich Bitcoin zuzuwenden. Was passiert also mit Dogecoin, dem größten Memecoin-Projekt auf dem Markt, während dieses Prozesses? Lass uns einen Blick darauf werfen.
Dogecoin Chart Analysis
Dogecoin-Chartanalyse
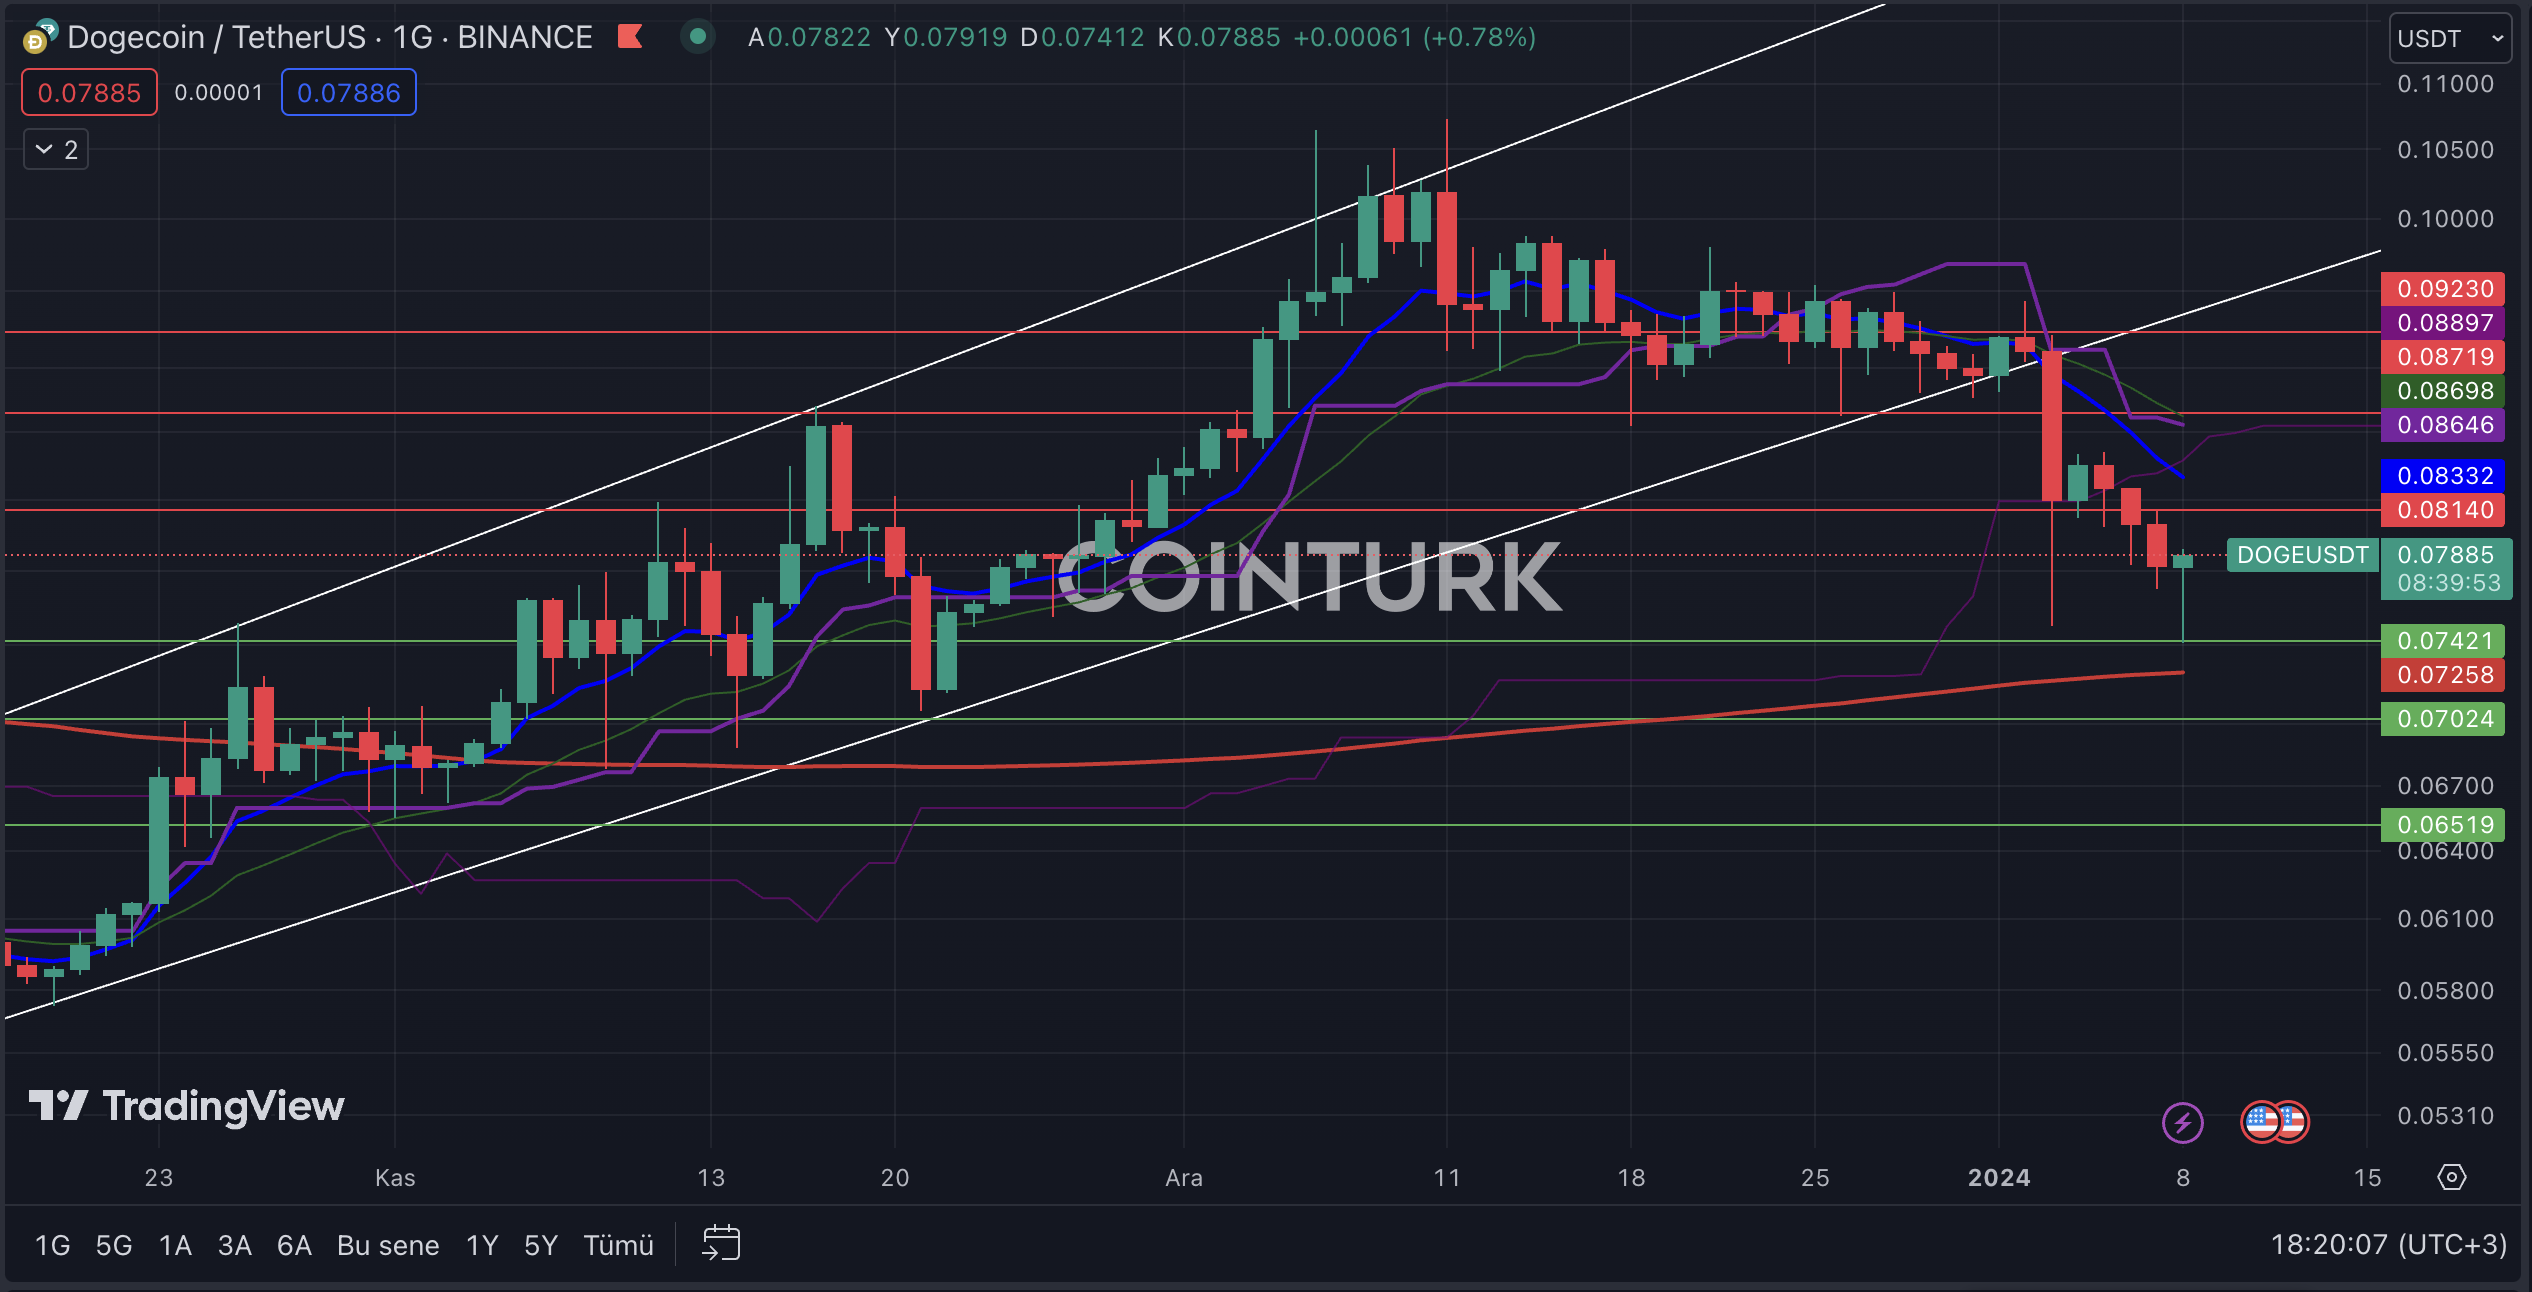
The daily DOGE chart was drawing attention with its ascending channel formation until the early days of 2024. However, the recent decline broke the support of the formation structure, and following this development, DOGE continues to face selling pressure. Support from the EMA 200 (red line) region, however, presents a positive scenario for the DOGE price.
Der tägliche DOGE-Chart erregte mit seiner aufsteigenden Kanalformation bis in die frühen Tage des Jahres 2024 Aufmerksamkeit. Der jüngste Rückgang brach jedoch die Unterstützung der Formationsstruktur, und nach dieser Entwicklung steht DOGE weiterhin unter Verkaufsdruck. Die Unterstützung durch den EMA 200-Bereich (rote Linie) stellt jedoch ein positives Szenario für den DOGE-Preis dar.
The most important support levels to watch on the DOGE chart are, in order; 0.07421 / 0.07024 and 0.06519 dollars. Particularly, a daily bar close below the 0.07421 dollar level, which played a major role in the last two declines, could lead to a drop in the DOGE price.
Die wichtigsten Unterstützungsniveaus, die Sie auf dem DOGE-Chart im Auge behalten sollten, sind in der Reihenfolge: 0,07421 / 0,07024 und 0,06519 Dollar. Insbesondere ein Tagesschlusskurs unterhalb der 0,07421-Dollar-Marke, die bei den letzten beiden Rückgängen eine wichtige Rolle gespielt hat, könnte zu einem Rückgang des DOGE-Preises führen.
The most important resistance levels to watch on the daily DOGE chart are, in order; 0.08140 / 0.08719 and 0.09230 dollars. Especially, a daily bar close above the 0.08140 dollar level, which was a significant barrier in the last upward move, will increase the momentum of the DOGE price.
Die wichtigsten Widerstandsniveaus, die Sie auf dem täglichen DOGE-Chart im Auge behalten sollten, sind in der Reihenfolge: 0,08140 / 0,08719 und 0,09230 Dollar. Insbesondere ein Tagesschlusskurs über der 0,08140-Dollar-Marke, die bei der letzten Aufwärtsbewegung ein erhebliches Hindernis darstellte, wird die Dynamik des DOGE-Preises erhöhen.

Dogecoin Weekly Chart Analysis
Wöchentliche Dogecoin-Chartanalyse
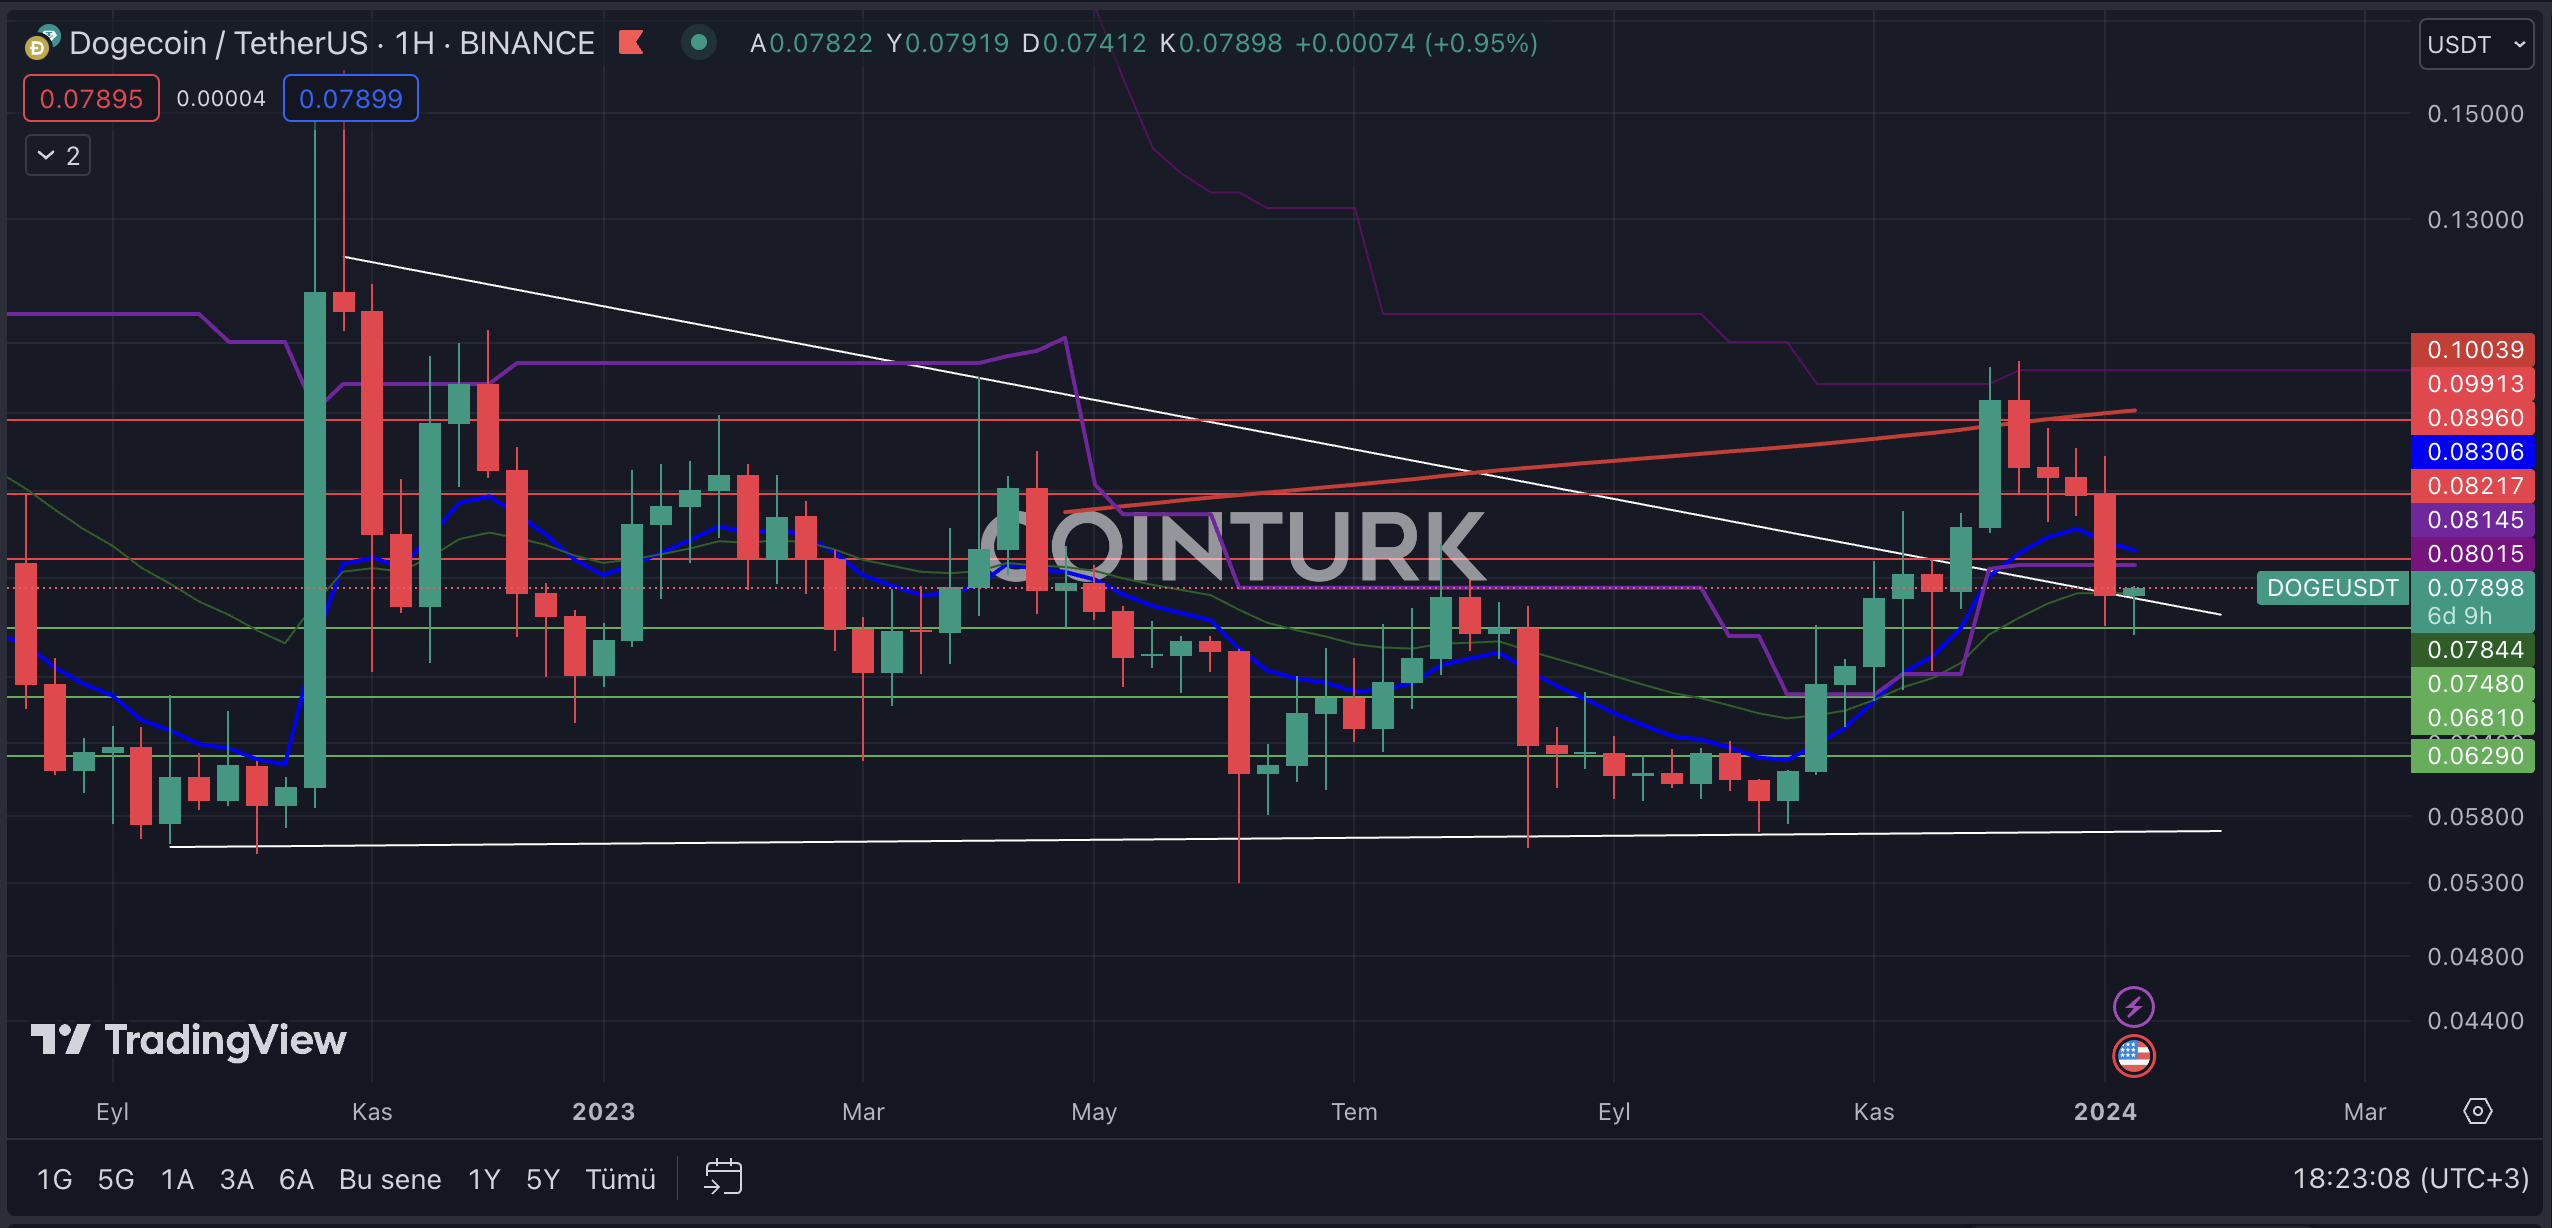
The first noticeable formation structure in the weekly Dogecoin chart is the contracting wedge formation. After breaking the resistance, DOGE, which encountered resistance at the EMA 200 level, could regain upward momentum if the formation resistance line acts as support. However, in the opposite case, a return to the formation area for DOGE could lead to contact with a potential support line and create significant selling pressure.
Die erste auffällige Formationsstruktur im wöchentlichen Dogecoin-Chart ist die kontrahierende Keilformation. Nach dem Durchbrechen des Widerstands könnte DOGE, das auf Widerstand beim EMA 200-Niveau stieß, wieder an Aufwärtsdynamik gewinnen, wenn die Formationswiderstandslinie als Unterstützung fungiert. Im umgekehrten Fall könnte jedoch eine Rückkehr in den Formationsbereich für DOGE zu einem Kontakt mit einer potenziellen Unterstützungslinie führen und erheblichen Verkaufsdruck erzeugen.
The most important support levels to watch on the weekly DOGE chart are, in order; 0.07480 / 0.06810 and 0.06290 dollars. Particularly, a weekly bar close below the 0.07480 dollar level, which played an important role in the formation of the last two bars, could lead to significant selling pressure on the DOGE price.
Die wichtigsten Unterstützungsniveaus, die Sie auf dem wöchentlichen DOGE-Chart im Auge behalten sollten, sind in der Reihenfolge: 0,07480 / 0,06810 und 0,06290 Dollar. Insbesondere ein wöchentlicher Balkenschluss unterhalb der 0,07480-Dollar-Marke, die eine wichtige Rolle bei der Bildung der letzten beiden Balken spielte, könnte zu erheblichem Verkaufsdruck auf den DOGE-Preis führen.
The most important resistance levels to watch on the DOGE chart are, in order; 0.08217 / 0.08960 and 0.09913 dollars. Especially, a weekly bar close above the 0.08217 dollar level, which intersects with the EMA 21 (blue line), will help the DOGE price gain momentum.
Die wichtigsten Widerstandsniveaus, die Sie auf dem DOGE-Chart im Auge behalten sollten, sind in der Reihenfolge: 0,08217 / 0,08960 und 0,09913 Dollar. Insbesondere ein wöchentlicher Balkenschluss über der 0,08217-Dollar-Marke, die sich mit dem EMA 21 (blaue Linie) schneidet, wird dazu beitragen, dass der DOGE-Preis an Dynamik gewinnt.

The post first appeared on COINTURK NEWS: Dogecoin Price Analysis Amidst Market Developments
Der Beitrag erschien zuerst auf COINTURK NEWS: Dogecoin-Preisanalyse inmitten von Marktentwicklungen


 Optimisus
 DogeHome
 Crypto News Land
 Optimisus
 Crypto News Land
 Crypto News Land
 Optimisus
 Cryptopolitan_News


