You can also read this news on COINTURK NEWS: Dogecoin Price Analysis Amidst Market Developments
このニュースは COINTURK NEWS でも読むことができます: 市場の発展の中でのドージコインの価格分析
With the latest developments in the cryptocurrency market, serious price corrections have occurred in the altcoin market. During this period, Bitcoin dominance continued to increase, and especially the growing optimism in spot Bitcoin ETF applications caused investors to turn to Bitcoin. So, what is happening with Dogecoin, the market’s largest memecoin project, during this process? Let’s take a look.
暗号通貨市場の最新の発展に伴い、アルトコイン市場では深刻な価格修正が発生しています。この期間中、ビットコインの優位性は高まり続け、特にスポットビットコインETFの申請における楽観的な見方の高まりにより、投資家はビットコインに目を向けるようになりました。では、市場最大のミームコインプロジェクトであるドージコインでは、このプロセスで何が起こっているのでしょうか?見てみましょう。
Dogecoin Chart Analysis
ドージコインチャート分析
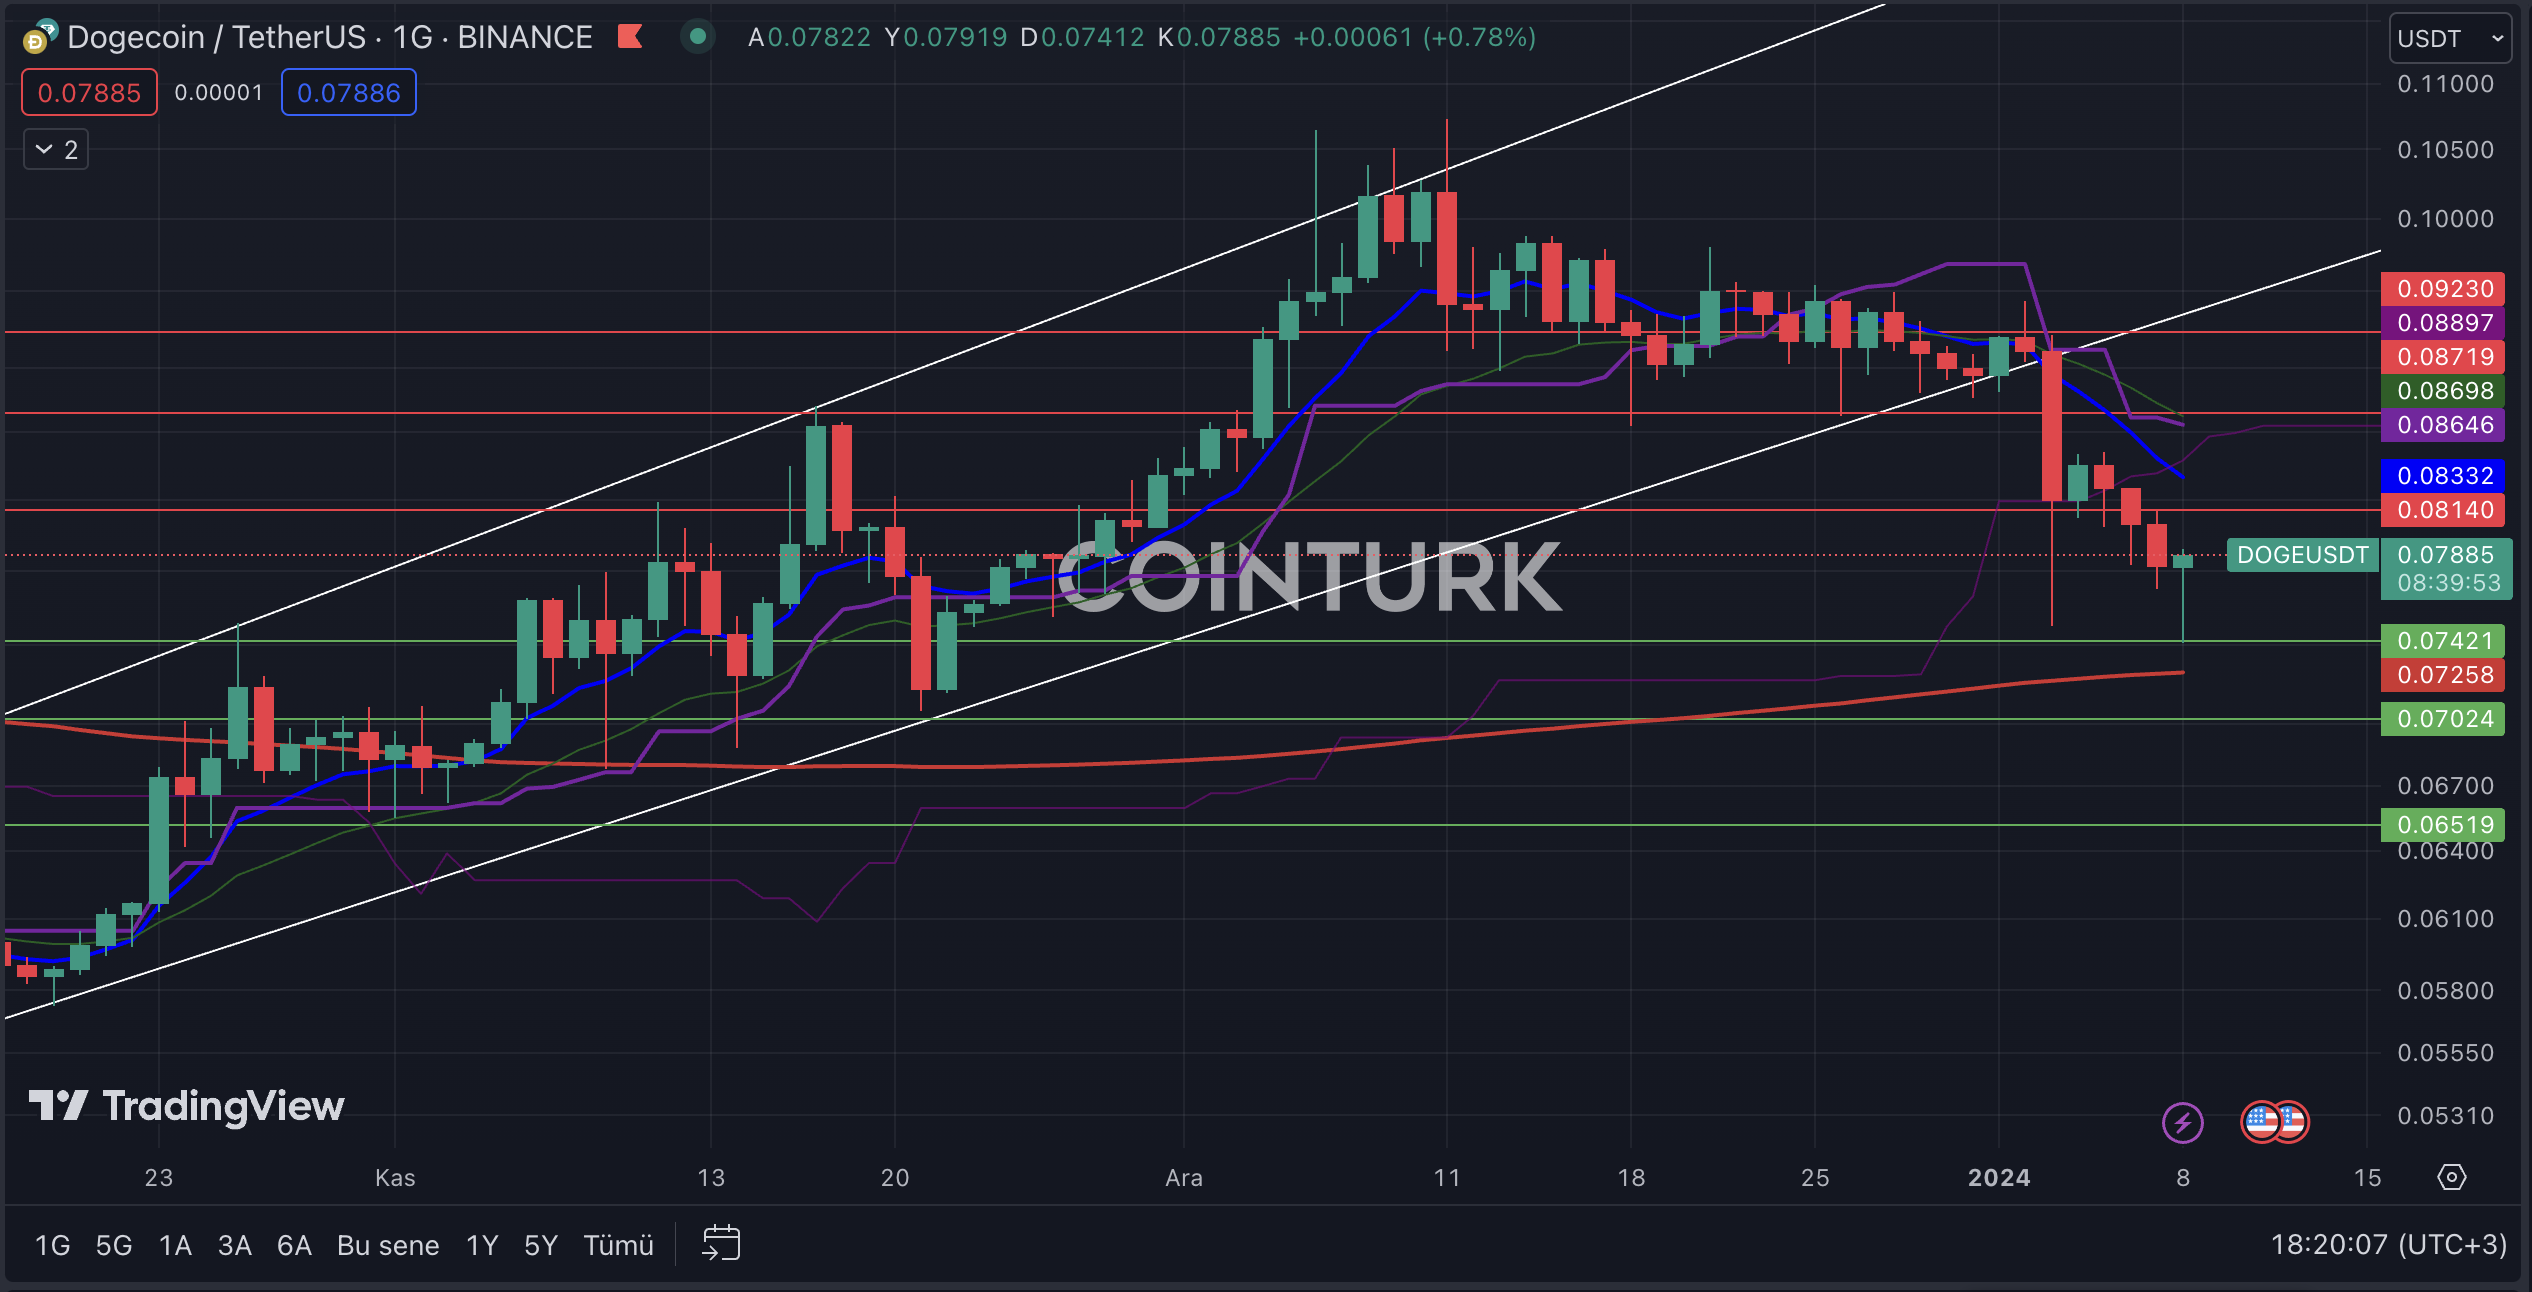
The daily DOGE chart was drawing attention with its ascending channel formation until the early days of 2024. However, the recent decline broke the support of the formation structure, and following this development, DOGE continues to face selling pressure. Support from the EMA 200 (red line) region, however, presents a positive scenario for the DOGE price.
DOGEの日足チャートは、2024年初頭まで上昇チャネル形成で注目を集めていましたが、最近の下落で形成構造のサポートが崩れ、この展開を受けてDOGEは引き続き売り圧力にさらされています。ただし、EMA 200 (赤線) 地域からのサポートは、DOGE 価格に前向きなシナリオを示しています。
The most important support levels to watch on the DOGE chart are, in order; 0.07421 / 0.07024 and 0.06519 dollars. Particularly, a daily bar close below the 0.07421 dollar level, which played a major role in the last two declines, could lead to a drop in the DOGE price.
DOGE チャートで注目すべき最も重要なサポート レベルは、順番に次のとおりです。 0.07421 / 0.07024 と 0.06519 ドル。特に、過去2回の下落に大きな役割を果たした0.07421ドルのレベルを下回る日足の終値は、DOGE価格の下落につながる可能性がある。
The most important resistance levels to watch on the daily DOGE chart are, in order; 0.08140 / 0.08719 and 0.09230 dollars. Especially, a daily bar close above the 0.08140 dollar level, which was a significant barrier in the last upward move, will increase the momentum of the DOGE price.
毎日の DOGE チャートで注目すべき最も重要な抵抗レベルは、次の順です。 0.08140 / 0.08719 と 0.09230 ドル。特に、前回の上昇の大きな障壁となった0.08140ドルのレベルを超えて日足が終われば、DOGE価格の勢いはさらに高まるだろう。

Dogecoin Weekly Chart Analysis
ドージコインの週間チャート分析
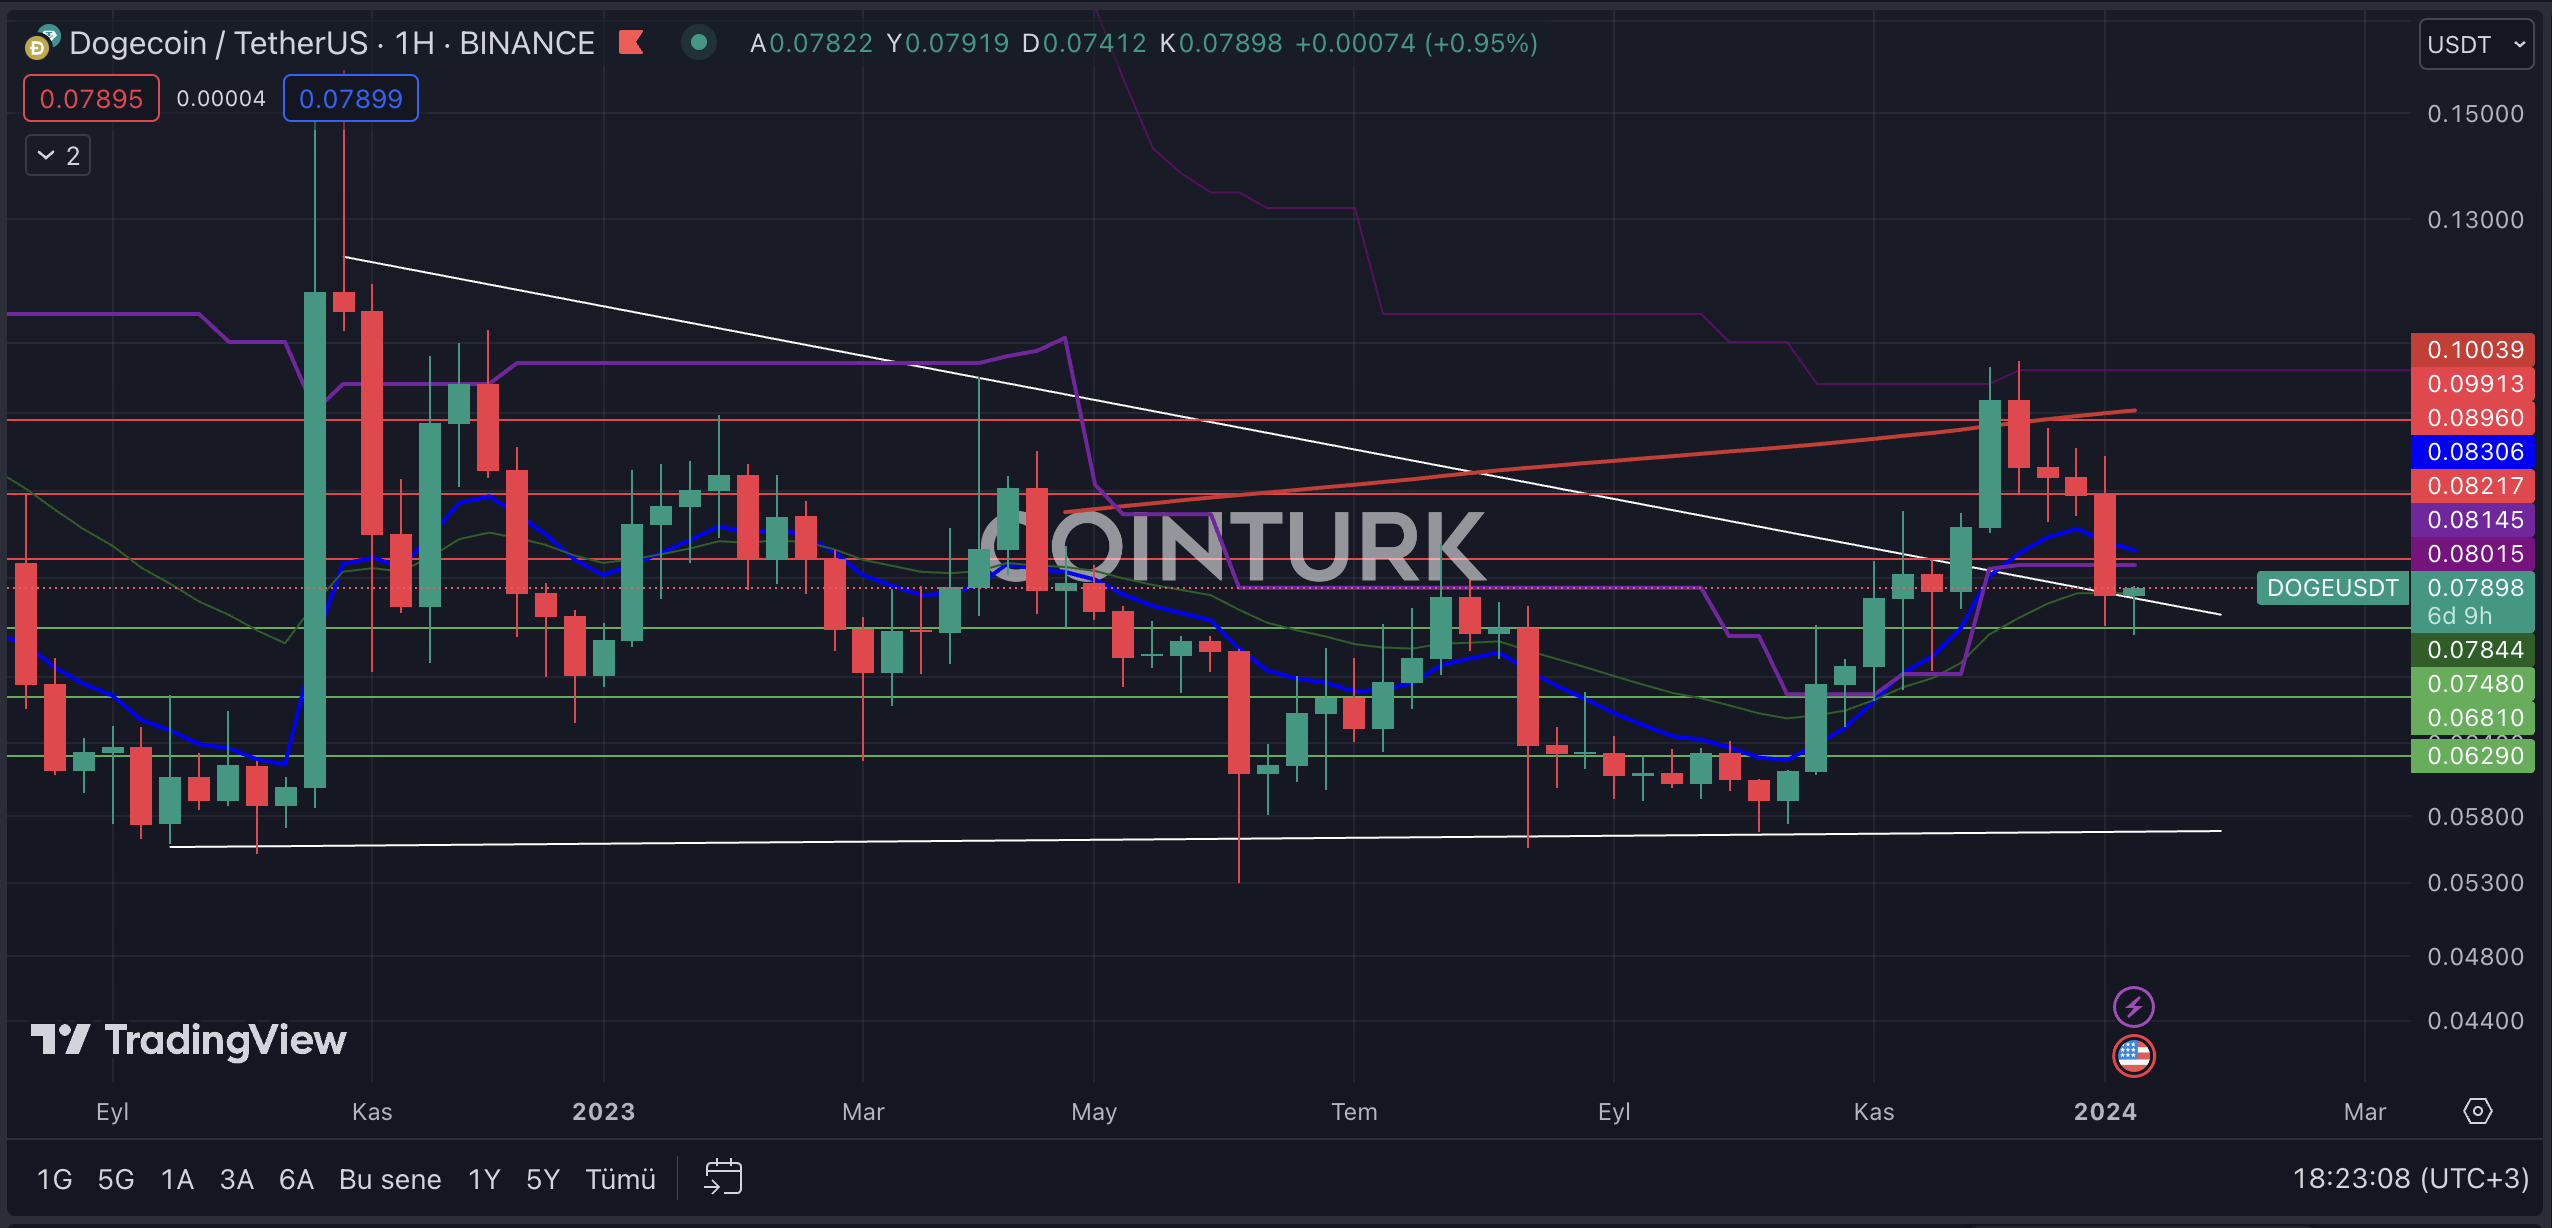
The first noticeable formation structure in the weekly Dogecoin chart is the contracting wedge formation. After breaking the resistance, DOGE, which encountered resistance at the EMA 200 level, could regain upward momentum if the formation resistance line acts as support. However, in the opposite case, a return to the formation area for DOGE could lead to contact with a potential support line and create significant selling pressure.
ドージコインの週間チャートで最初に注目すべきフォーメーション構造は、縮小ウェッジフォーメーションです。レジスタンスを突破した後、EMA 200レベルでレジスタンスに遭遇したDOGEは、形成レジスタンスラインがサポートとして機能する場合、上昇の勢いを取り戻す可能性があります。しかし、逆のケースでは、DOGEが形成エリアに戻ると潜在的なサポートラインとの接触につながり、大きな売り圧力が生じる可能性があります。
The most important support levels to watch on the weekly DOGE chart are, in order; 0.07480 / 0.06810 and 0.06290 dollars. Particularly, a weekly bar close below the 0.07480 dollar level, which played an important role in the formation of the last two bars, could lead to significant selling pressure on the DOGE price.
週次DOGEチャートで注目すべき最も重要なサポートレベルは、順番に次のとおりです。 0.07480 / 0.06810 と 0.06290 ドル。特に、最後の2つの足の形成に重要な役割を果たした0.07480ドルレベルを下回る週足の終値は、DOGE価格に対する大きな売り圧力につながる可能性があります。
The most important resistance levels to watch on the DOGE chart are, in order; 0.08217 / 0.08960 and 0.09913 dollars. Especially, a weekly bar close above the 0.08217 dollar level, which intersects with the EMA 21 (blue line), will help the DOGE price gain momentum.
DOGE チャートで注目すべき最も重要な抵抗レベルは、順番に次のとおりです。 0.08217 / 0.08960 と 0.09913 ドル。特に、週足がEMA 21(青い線)と交差する0.08217ドルレベルを超えて終了すると、DOGE価格の勢いが増すでしょう。

The post first appeared on COINTURK NEWS: Dogecoin Price Analysis Amidst Market Developments
この投稿は COINTURK NEWS に最初に掲載されました: 市場発展の中でのドージコイン価格分析


 DogeHome
 Optimisus
 Crypto News Land
 Optimisus
 Crypto News Land
 Crypto News Land
 Optimisus
 Cryptopolitan_News


