You can also read this news on COINTURK NEWS: Dogecoin Price Analysis Amidst Market Developments
您还可以在 COINTURK NEWS 上阅读此新闻:市场发展中的狗狗币价格分析
With the latest developments in the cryptocurrency market, serious price corrections have occurred in the altcoin market. During this period, Bitcoin dominance continued to increase, and especially the growing optimism in spot Bitcoin ETF applications caused investors to turn to Bitcoin. So, what is happening with Dogecoin, the market’s largest memecoin project, during this process? Let’s take a look.
随着加密货币市场的最新发展,山寨币市场出现了严重的价格调整。在此期间,比特币的主导地位持续增强,尤其是现货比特币ETF应用的乐观情绪日益高涨,导致投资者转向比特币。那么,市场上最大的模因币项目狗狗币在这个过程中发生了什么?让我们来看看。
Dogecoin Chart Analysis
狗狗币图表分析
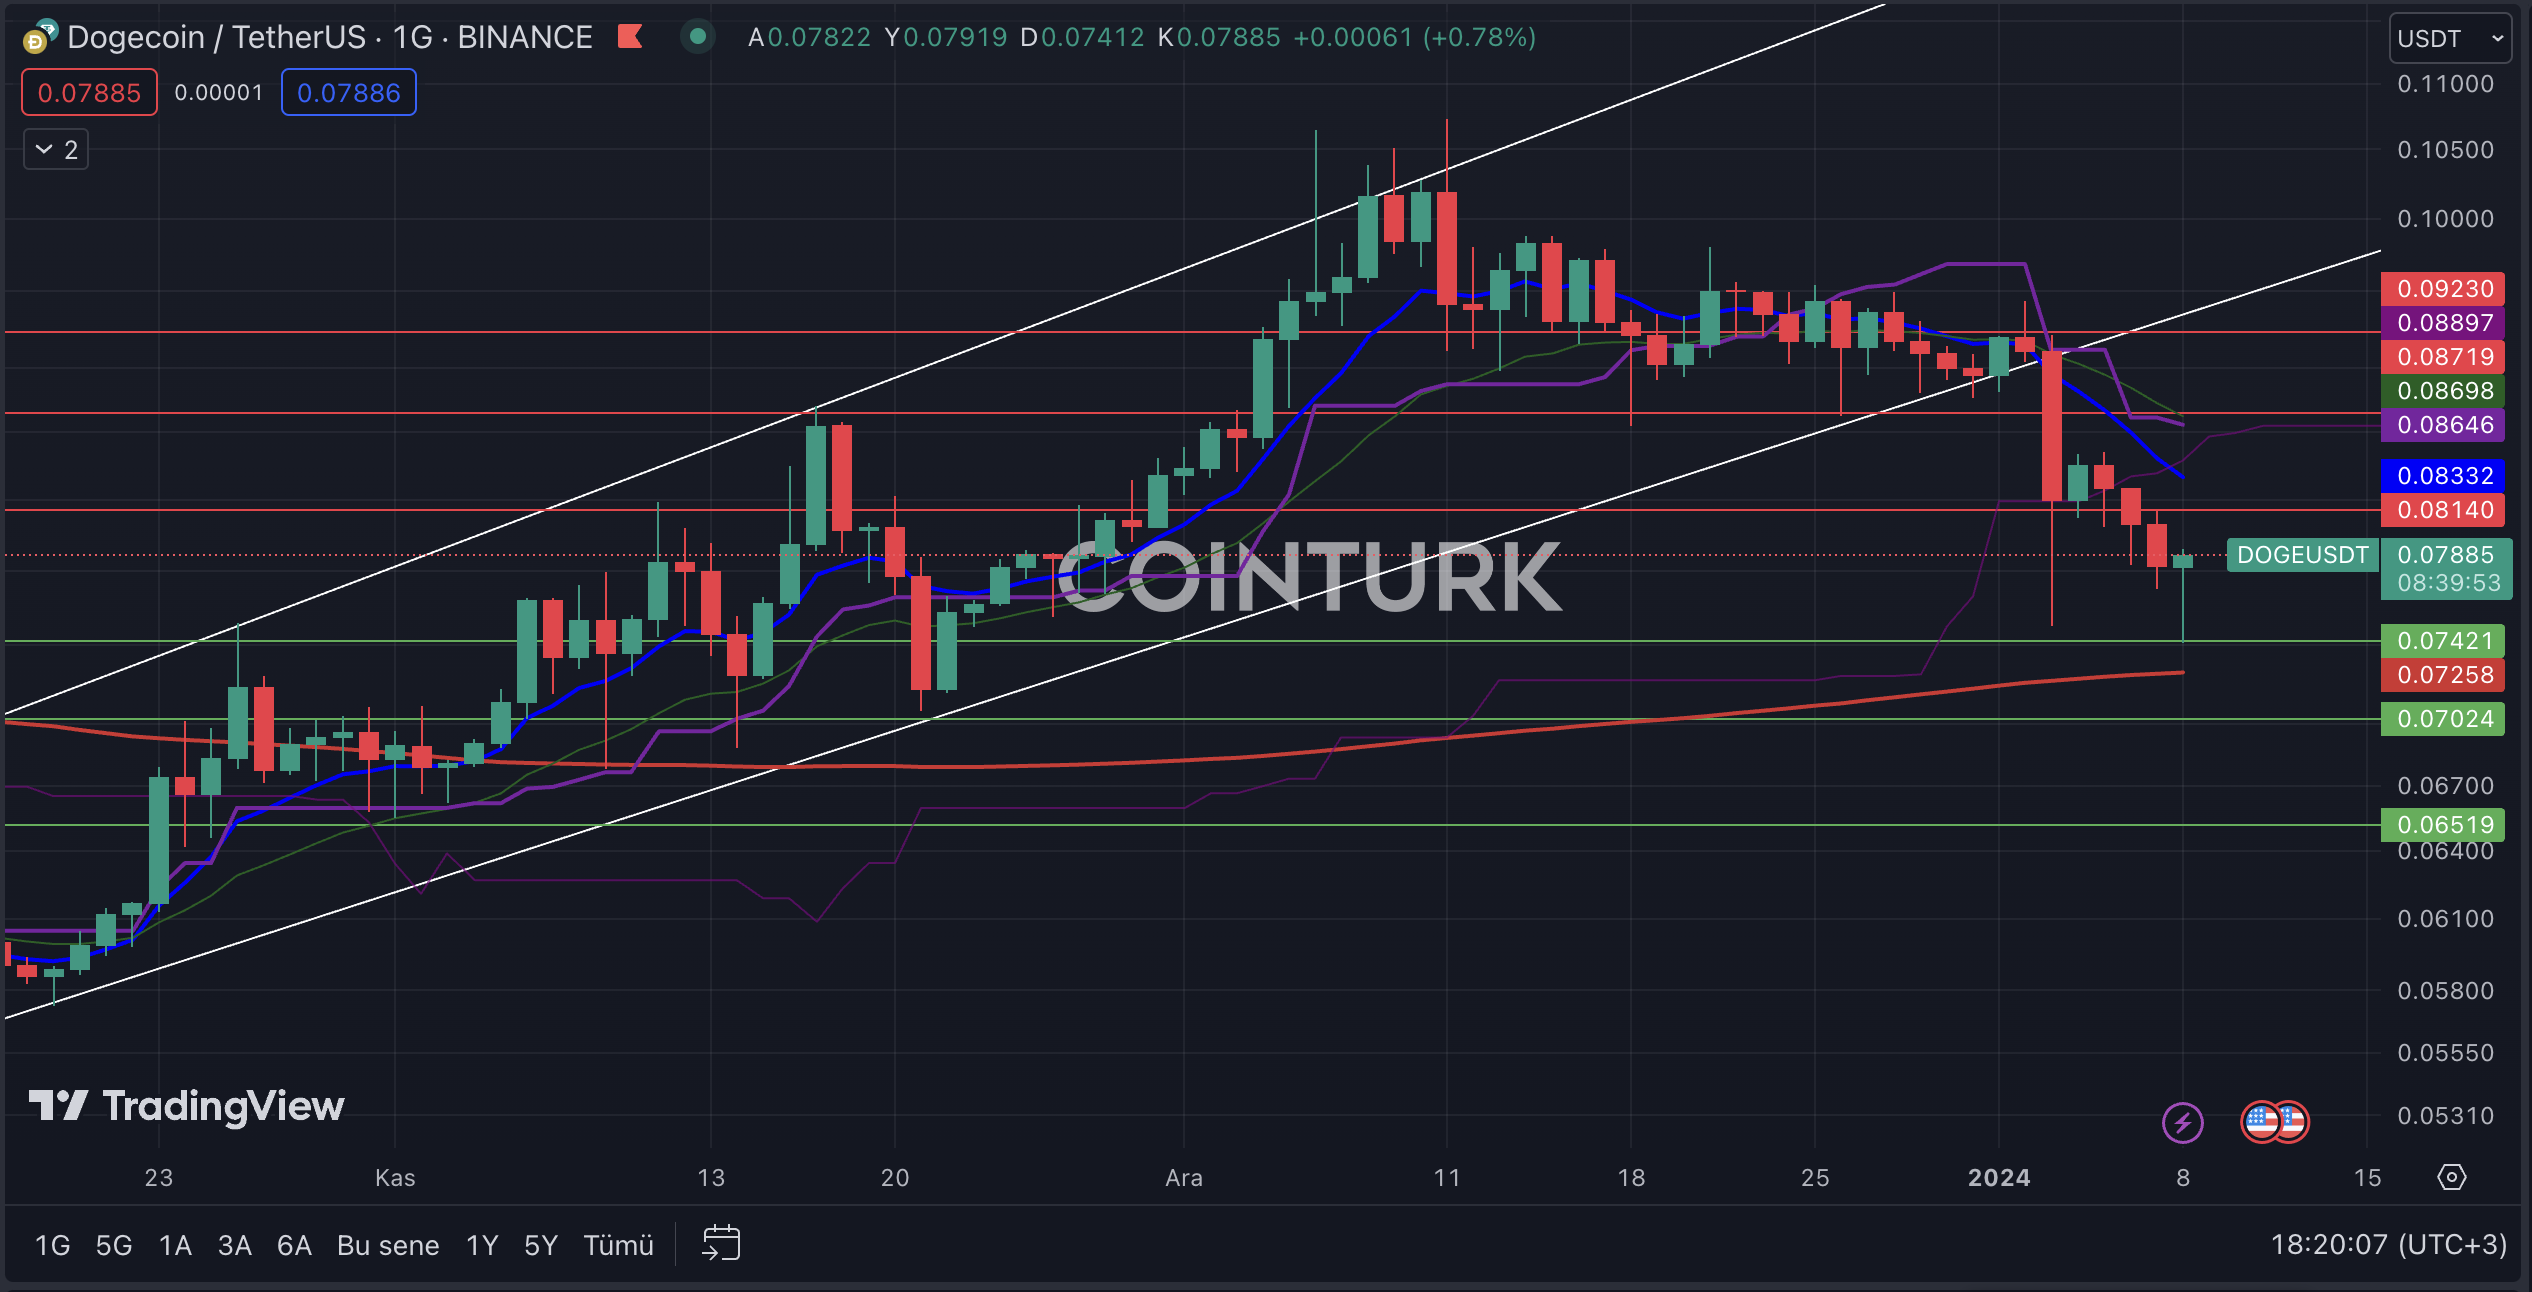
The daily DOGE chart was drawing attention with its ascending channel formation until the early days of 2024. However, the recent decline broke the support of the formation structure, and following this development, DOGE continues to face selling pressure. Support from the EMA 200 (red line) region, however, presents a positive scenario for the DOGE price.
直到 2024 年初,DOGE 日线图一直以其上升通道的形成而引起人们的关注。然而,最近的下跌打破了该形成结构的支撑,随着这一发展,DOGE 继续面临抛售压力。然而,来自 EMA 200(红线)区域的支撑为 DOGE 价格带来了积极的前景。
The most important support levels to watch on the DOGE chart are, in order; 0.07421 / 0.07024 and 0.06519 dollars. Particularly, a daily bar close below the 0.07421 dollar level, which played a major role in the last two declines, could lead to a drop in the DOGE price.
DOGE 图表上最重要的支撑位依次为: 0.07421 / 0.07024 和 0.06519 美元。特别是,日线收盘价低于 0.07421 美元水平(这在过去两次下跌中发挥了重要作用)可能会导致 DOGE 价格下跌。
The most important resistance levels to watch on the daily DOGE chart are, in order; 0.08140 / 0.08719 and 0.09230 dollars. Especially, a daily bar close above the 0.08140 dollar level, which was a significant barrier in the last upward move, will increase the momentum of the DOGE price.
每日 DOGE 图表上需要关注的最重要阻力位依次为: 0.08140 / 0.08719 和 0.09230 美元。特别是,日线收盘价高于 0.08140 美元水平,这是上次上涨的一个重要障碍,将增加 DOGE 价格的动力。

Dogecoin Weekly Chart Analysis
狗狗币每周图表分析
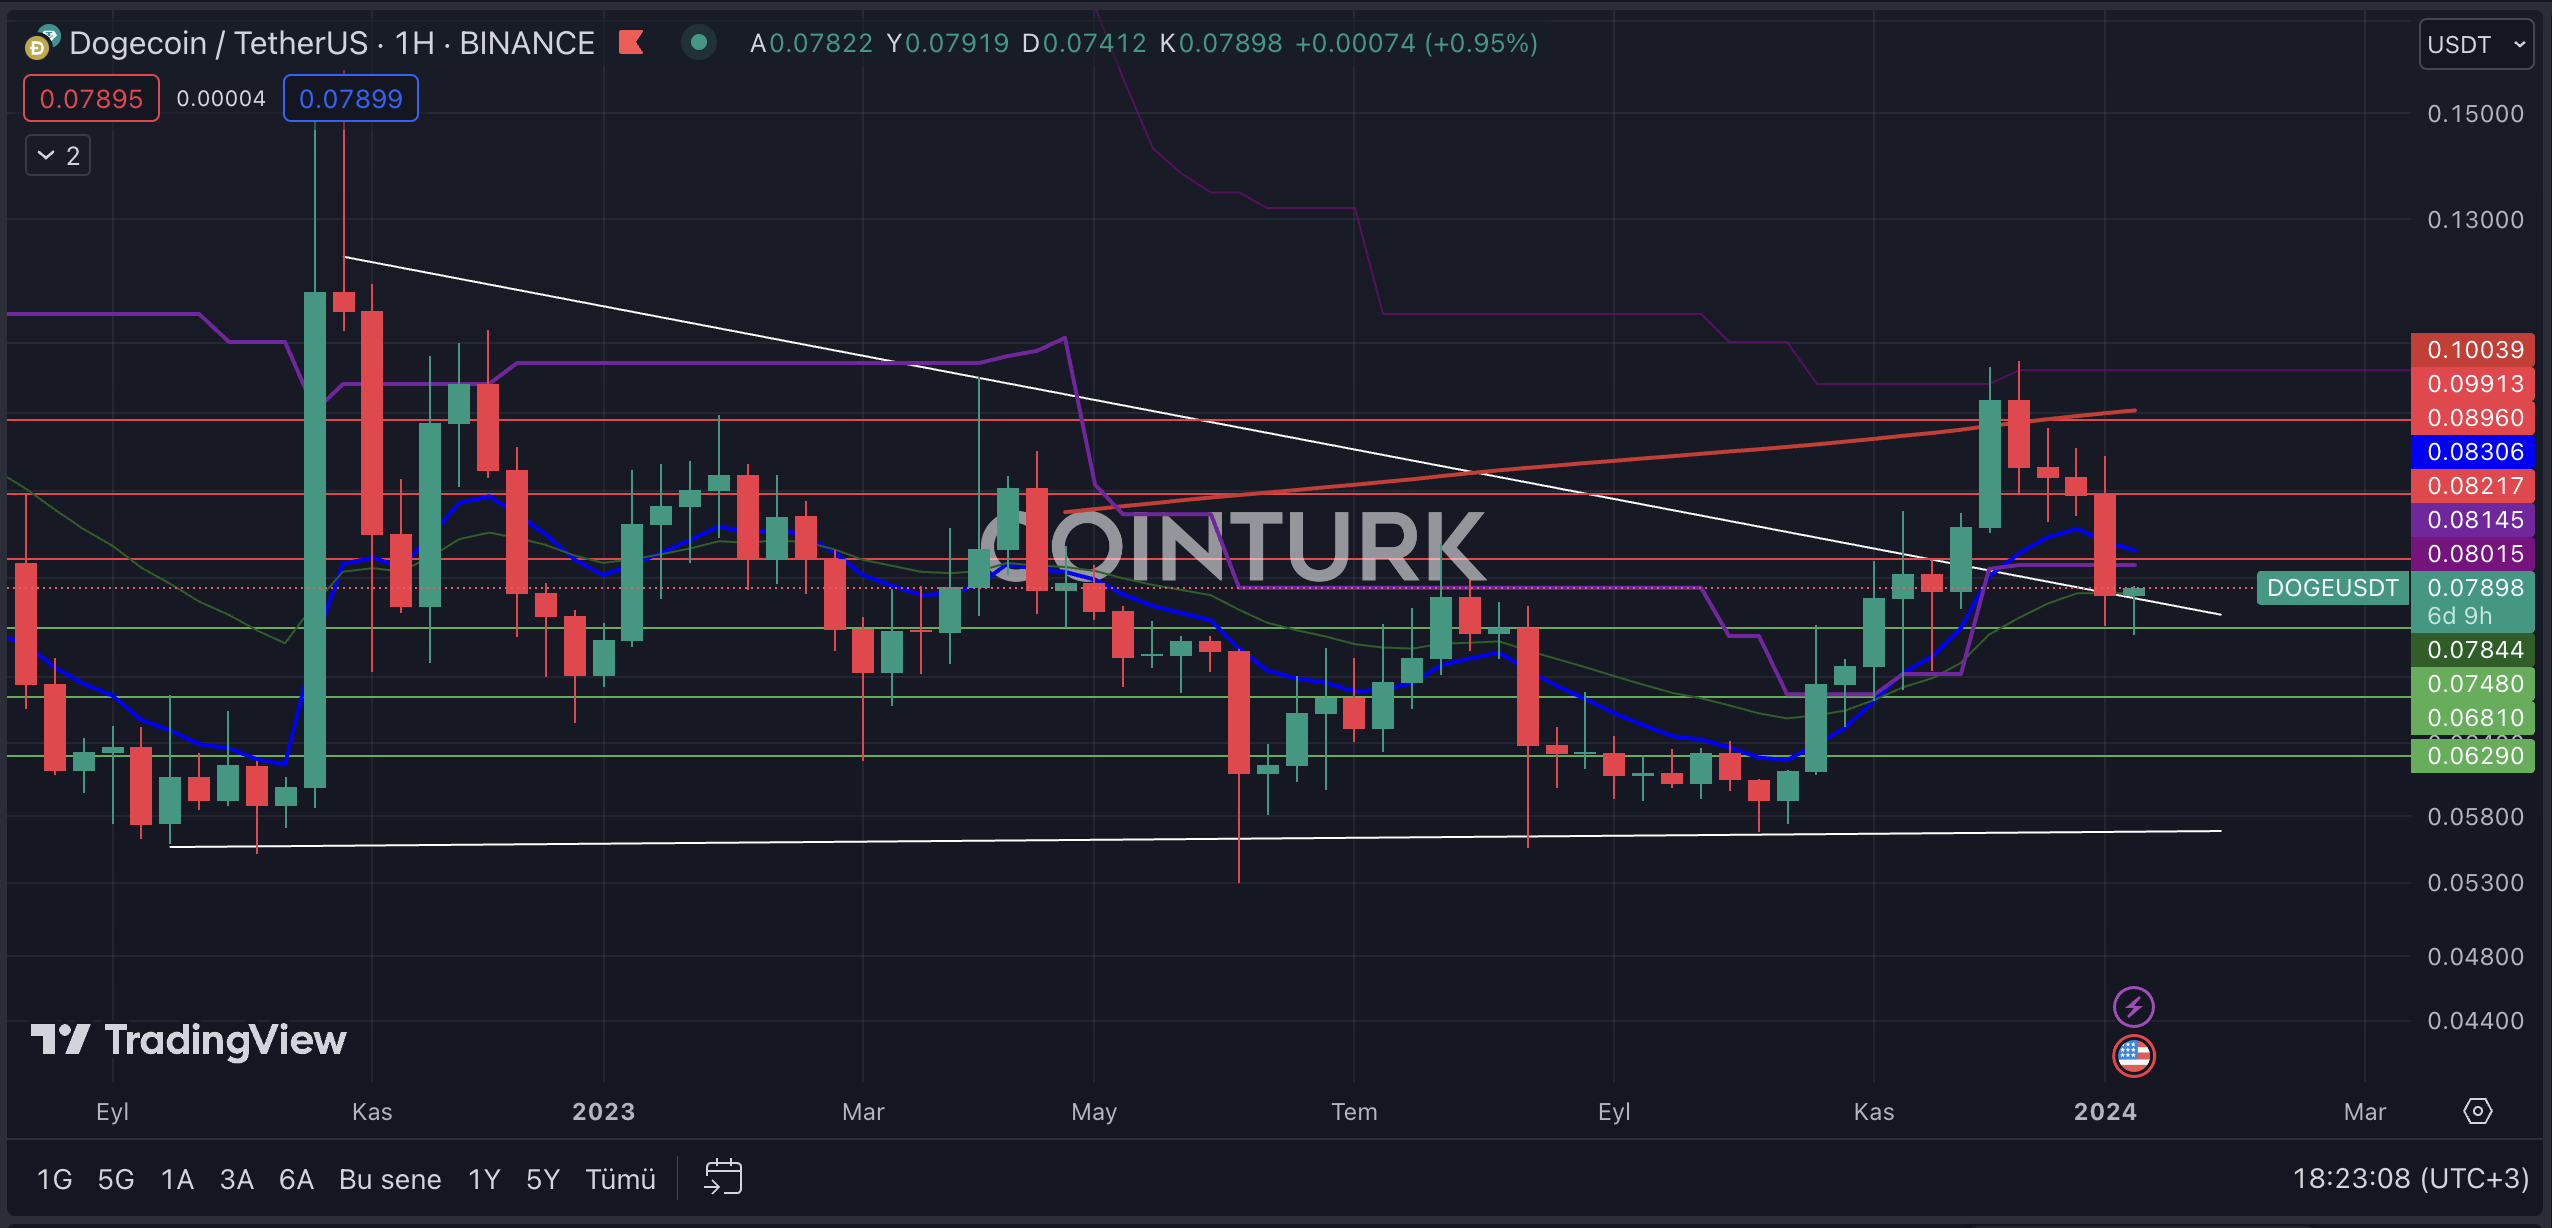
The first noticeable formation structure in the weekly Dogecoin chart is the contracting wedge formation. After breaking the resistance, DOGE, which encountered resistance at the EMA 200 level, could regain upward momentum if the formation resistance line acts as support. However, in the opposite case, a return to the formation area for DOGE could lead to contact with a potential support line and create significant selling pressure.
狗狗币周线图中第一个值得注意的形态结构是收缩楔形形态。突破阻力后,在 200 EMA 水平遇到阻力的 DOGE,如果形成阻力线作为支撑,可能会重新获得上涨动力。然而,在相反的情况下,DOGE 回到形成区域可能会导致与潜在支撑线接触并产生巨大的抛售压力。
The most important support levels to watch on the weekly DOGE chart are, in order; 0.07480 / 0.06810 and 0.06290 dollars. Particularly, a weekly bar close below the 0.07480 dollar level, which played an important role in the formation of the last two bars, could lead to significant selling pressure on the DOGE price.
每周 DOGE 图表上值得关注的最重要支撑位依次为: 0.07480 / 0.06810 和 0.06290 美元。特别是,周线收盘价低于 0.07480 美元水平(这在最后两条线的形成中发挥了重要作用)可能会对 DOGE 价格造成巨大的抛售压力。
The most important resistance levels to watch on the DOGE chart are, in order; 0.08217 / 0.08960 and 0.09913 dollars. Especially, a weekly bar close above the 0.08217 dollar level, which intersects with the EMA 21 (blue line), will help the DOGE price gain momentum.
DOGE 图表上最重要的阻力位依次为: 0.08217 / 0.08960 和 0.09913 美元。特别是,周线收盘于 0.08217 美元水平之上,与 21 EMA(蓝线)相交,将有助于 DOGE 价格获得动力。

The post first appeared on COINTURK NEWS: Dogecoin Price Analysis Amidst Market Developments
该帖子首次出现在 COINTURK 新闻:市场发展中的狗狗币价格分析


 Optimisus
 DogeHome
 Crypto News Land
 Optimisus
 Crypto News Land
 Crypto News Land
 Optimisus
 Cryptopolitan_News


