You can also read this news on COINTURK NEWS: Dogecoin Price Analysis Amidst Market Developments
COINTURK NEWS: 시장 개발 중 Dogecoin 가격 분석에서도 이 뉴스를 읽을 수 있습니다.
With the latest developments in the cryptocurrency market, serious price corrections have occurred in the altcoin market. During this period, Bitcoin dominance continued to increase, and especially the growing optimism in spot Bitcoin ETF applications caused investors to turn to Bitcoin. So, what is happening with Dogecoin, the market’s largest memecoin project, during this process? Let’s take a look.
암호화폐 시장의 최신 발전으로 인해 알트코인 시장에서는 심각한 가격 조정이 발생했습니다. 이 기간 동안 비트코인 지배력은 계속 증가했으며 특히 현물 비트코인 ETF 신청에 대한 낙관론이 커지면서 투자자들이 비트코인으로 눈을 돌리게 되었습니다. 그렇다면 이 과정에서 시장 최대 규모의 밈코인 프로젝트인 도지코인에서는 무슨 일이 벌어지고 있는 걸까요? 한 번 보자.
Dogecoin Chart Analysis
도지코인 차트 분석
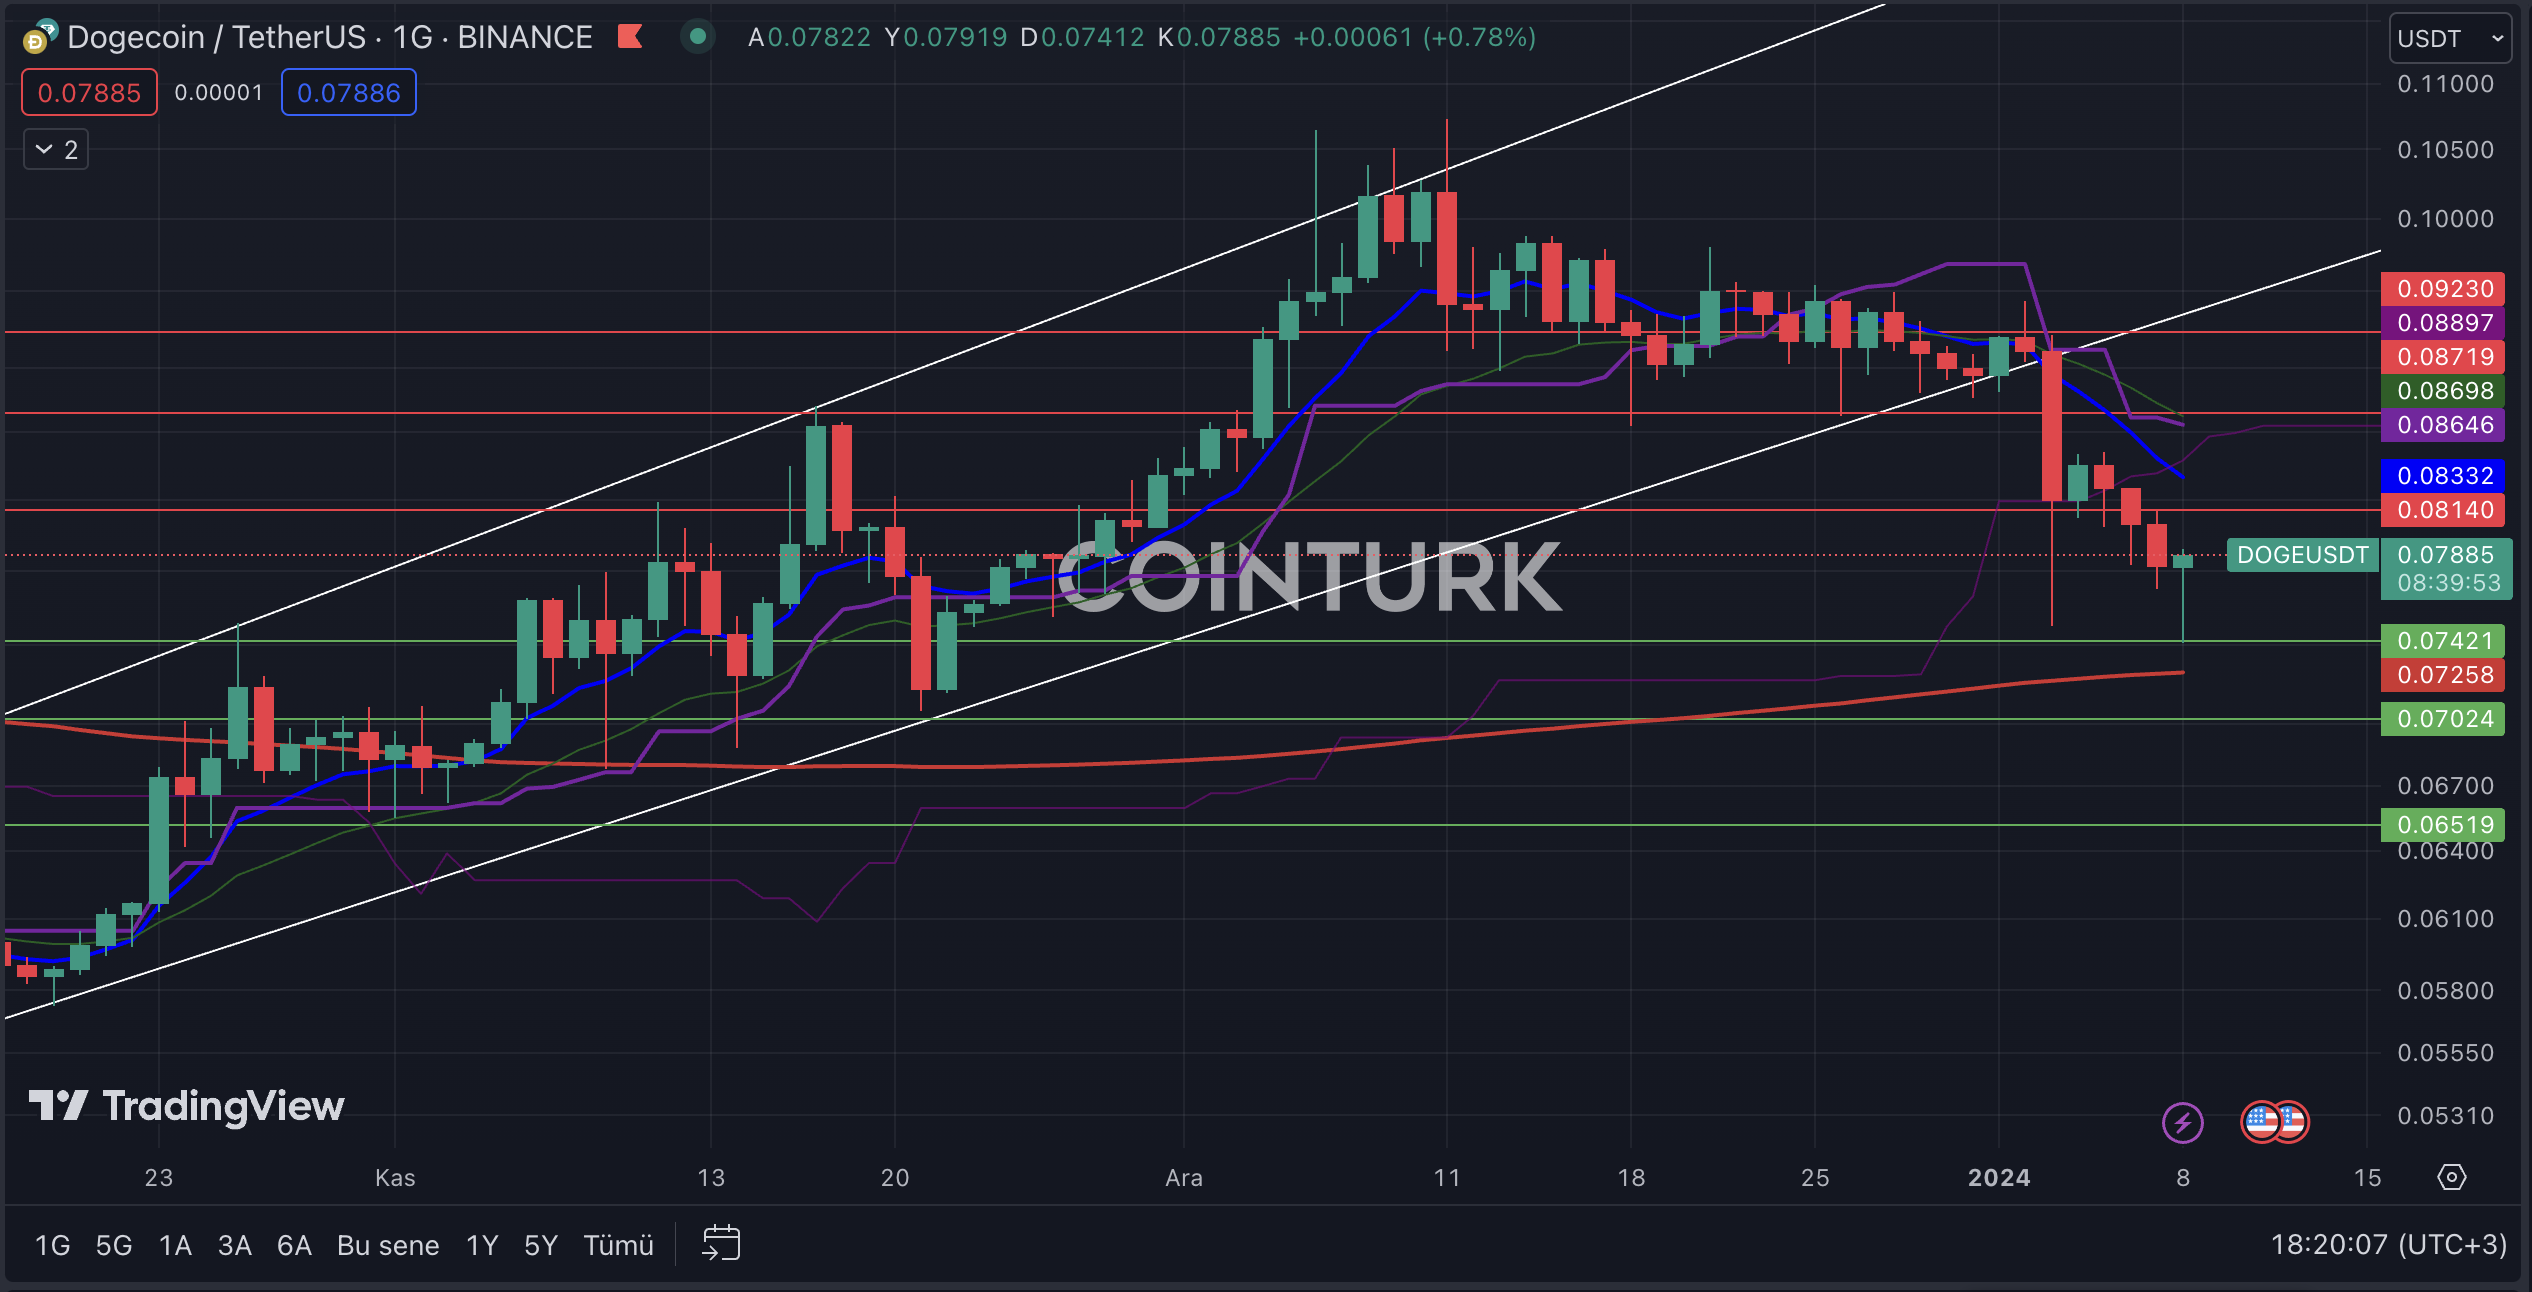
The daily DOGE chart was drawing attention with its ascending channel formation until the early days of 2024. However, the recent decline broke the support of the formation structure, and following this development, DOGE continues to face selling pressure. Support from the EMA 200 (red line) region, however, presents a positive scenario for the DOGE price.
일봉 DOGE 차트는 2024년 초반까지 상승 채널 형성으로 주목을 끌었습니다. 그러나 최근 하락세로 형성 구조의 지지가 무너졌고, 이러한 전개에 따라 DOGE는 계속해서 매도 압력에 직면해 있습니다. 그러나 EMA 200(빨간색 선) 지역의 지원은 DOGE 가격에 대한 긍정적인 시나리오를 제시합니다.
The most important support levels to watch on the DOGE chart are, in order; 0.07421 / 0.07024 and 0.06519 dollars. Particularly, a daily bar close below the 0.07421 dollar level, which played a major role in the last two declines, could lead to a drop in the DOGE price.
DOGE 차트에서 주목해야 할 가장 중요한 지원 수준은 다음과 같습니다. 0.07421 / 0.07024 및 0.06519 달러. 특히 지난 두 번의 하락에서 큰 역할을 했던 0.07421달러 수준 아래로 마감된 일일 바는 DOGE 가격 하락으로 이어질 수 있습니다.
The most important resistance levels to watch on the daily DOGE chart are, in order; 0.08140 / 0.08719 and 0.09230 dollars. Especially, a daily bar close above the 0.08140 dollar level, which was a significant barrier in the last upward move, will increase the momentum of the DOGE price.
일일 DOGE 차트에서 관찰해야 할 가장 중요한 저항 수준은 다음과 같습니다. 0.08140 / 0.08719 및 0.09230 달러. 특히 지난 상승세의 큰 장벽이었던 0.08140달러 수준 위에서 마감된 일일 바는 DOGE 가격의 모멘텀을 높일 것입니다.

Dogecoin Weekly Chart Analysis
Dogecoin 주간 차트 분석
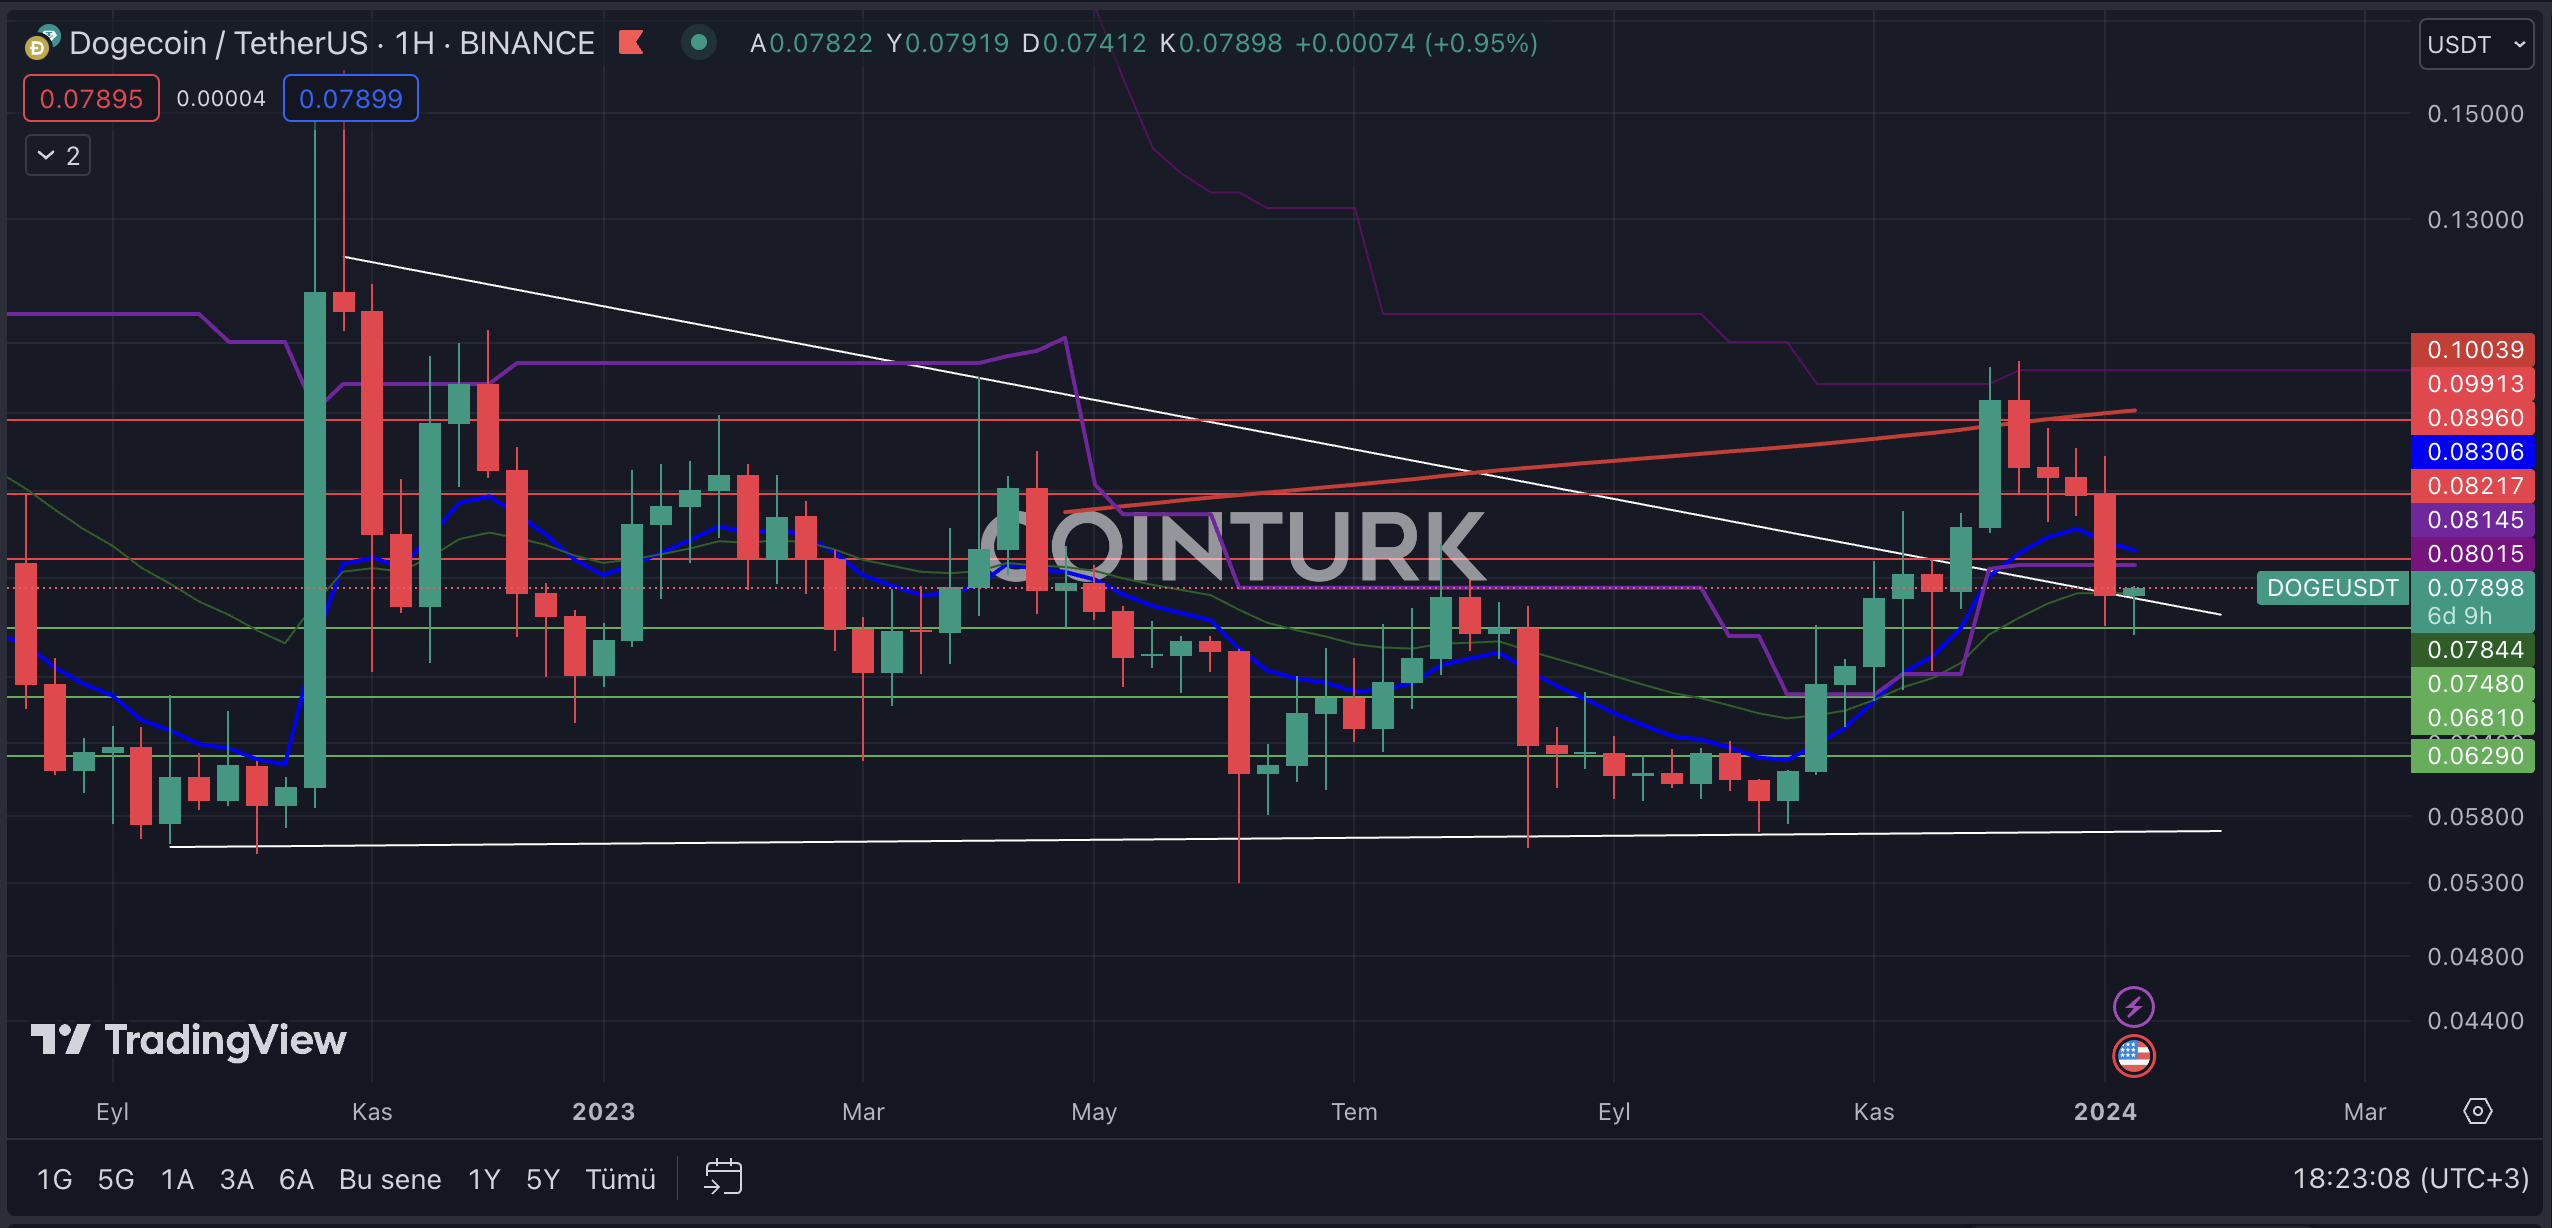
The first noticeable formation structure in the weekly Dogecoin chart is the contracting wedge formation. After breaking the resistance, DOGE, which encountered resistance at the EMA 200 level, could regain upward momentum if the formation resistance line acts as support. However, in the opposite case, a return to the formation area for DOGE could lead to contact with a potential support line and create significant selling pressure.
주간 Dogecoin 차트에서 가장 먼저 눈에 띄는 형성 구조는 수축하는 쐐기 형성입니다. 저항선을 돌파한 후 EMA 200 수준에서 저항을 받은 DOGE는 형성 저항선이 지지 역할을 한다면 상승 모멘텀을 회복할 수 있습니다. 그러나 반대의 경우 DOGE가 형성되는 영역으로 복귀하면 잠재적 지지선과의 접촉으로 이어질 수 있으며 상당한 매도 압력이 발생할 수 있습니다.
The most important support levels to watch on the weekly DOGE chart are, in order; 0.07480 / 0.06810 and 0.06290 dollars. Particularly, a weekly bar close below the 0.07480 dollar level, which played an important role in the formation of the last two bars, could lead to significant selling pressure on the DOGE price.
주간 DOGE 차트에서 주목해야 할 가장 중요한 지원 수준은 다음과 같습니다. 0.07480 / 0.06810 및 0.06290 달러. 특히, 마지막 두 바 형성에 중요한 역할을 했던 0.07480달러 수준 아래로 마감된 주간 바는 DOGE 가격에 상당한 매도 압력을 가할 수 있습니다.
The most important resistance levels to watch on the DOGE chart are, in order; 0.08217 / 0.08960 and 0.09913 dollars. Especially, a weekly bar close above the 0.08217 dollar level, which intersects with the EMA 21 (blue line), will help the DOGE price gain momentum.
DOGE 차트에서 관찰해야 할 가장 중요한 저항 수준은 다음과 같습니다. 0.08217 / 0.08960 및 0.09913 달러. 특히 EMA 21(파란색 선)과 교차하는 0.08217 달러 수준 위에서 마감되는 주간 막대는 DOGE 가격이 모멘텀을 얻는 데 도움이 될 것입니다.

The post first appeared on COINTURK NEWS: Dogecoin Price Analysis Amidst Market Developments
이 게시물은 COINTURK NEWS: 시장 개발 중 Dogecoin 가격 분석에 처음 게재되었습니다.


 BlockchainReporter
 Optimisus
 DogeHome
 Crypto News Land
 Optimisus
 Crypto News Land
 Crypto News Land
 Optimisus


