Technical analysis is an essential indicator that investors, especially those trading in the futures market, need to constantly monitor in the cryptocurrency market. So what does technical analysis tell us about Dogecoin, which is currently trading at $0.07749? Let’s examine the detailed charts and important support and resistance levels.
Die technische Analyse ist ein wesentlicher Indikator, den Anleger, insbesondere diejenigen, die auf dem Terminmarkt handeln, auf dem Kryptowährungsmarkt ständig überwachen müssen. Was sagt uns die technische Analyse also über Dogecoin, der derzeit bei 0,07749 US-Dollar gehandelt wird? Schauen wir uns die detaillierten Diagramme und wichtigen Unterstützungs- und Widerstandsniveaus an.
Dogecoin Daily Chart Analysis
Tägliche Dogecoin-Chartanalyse
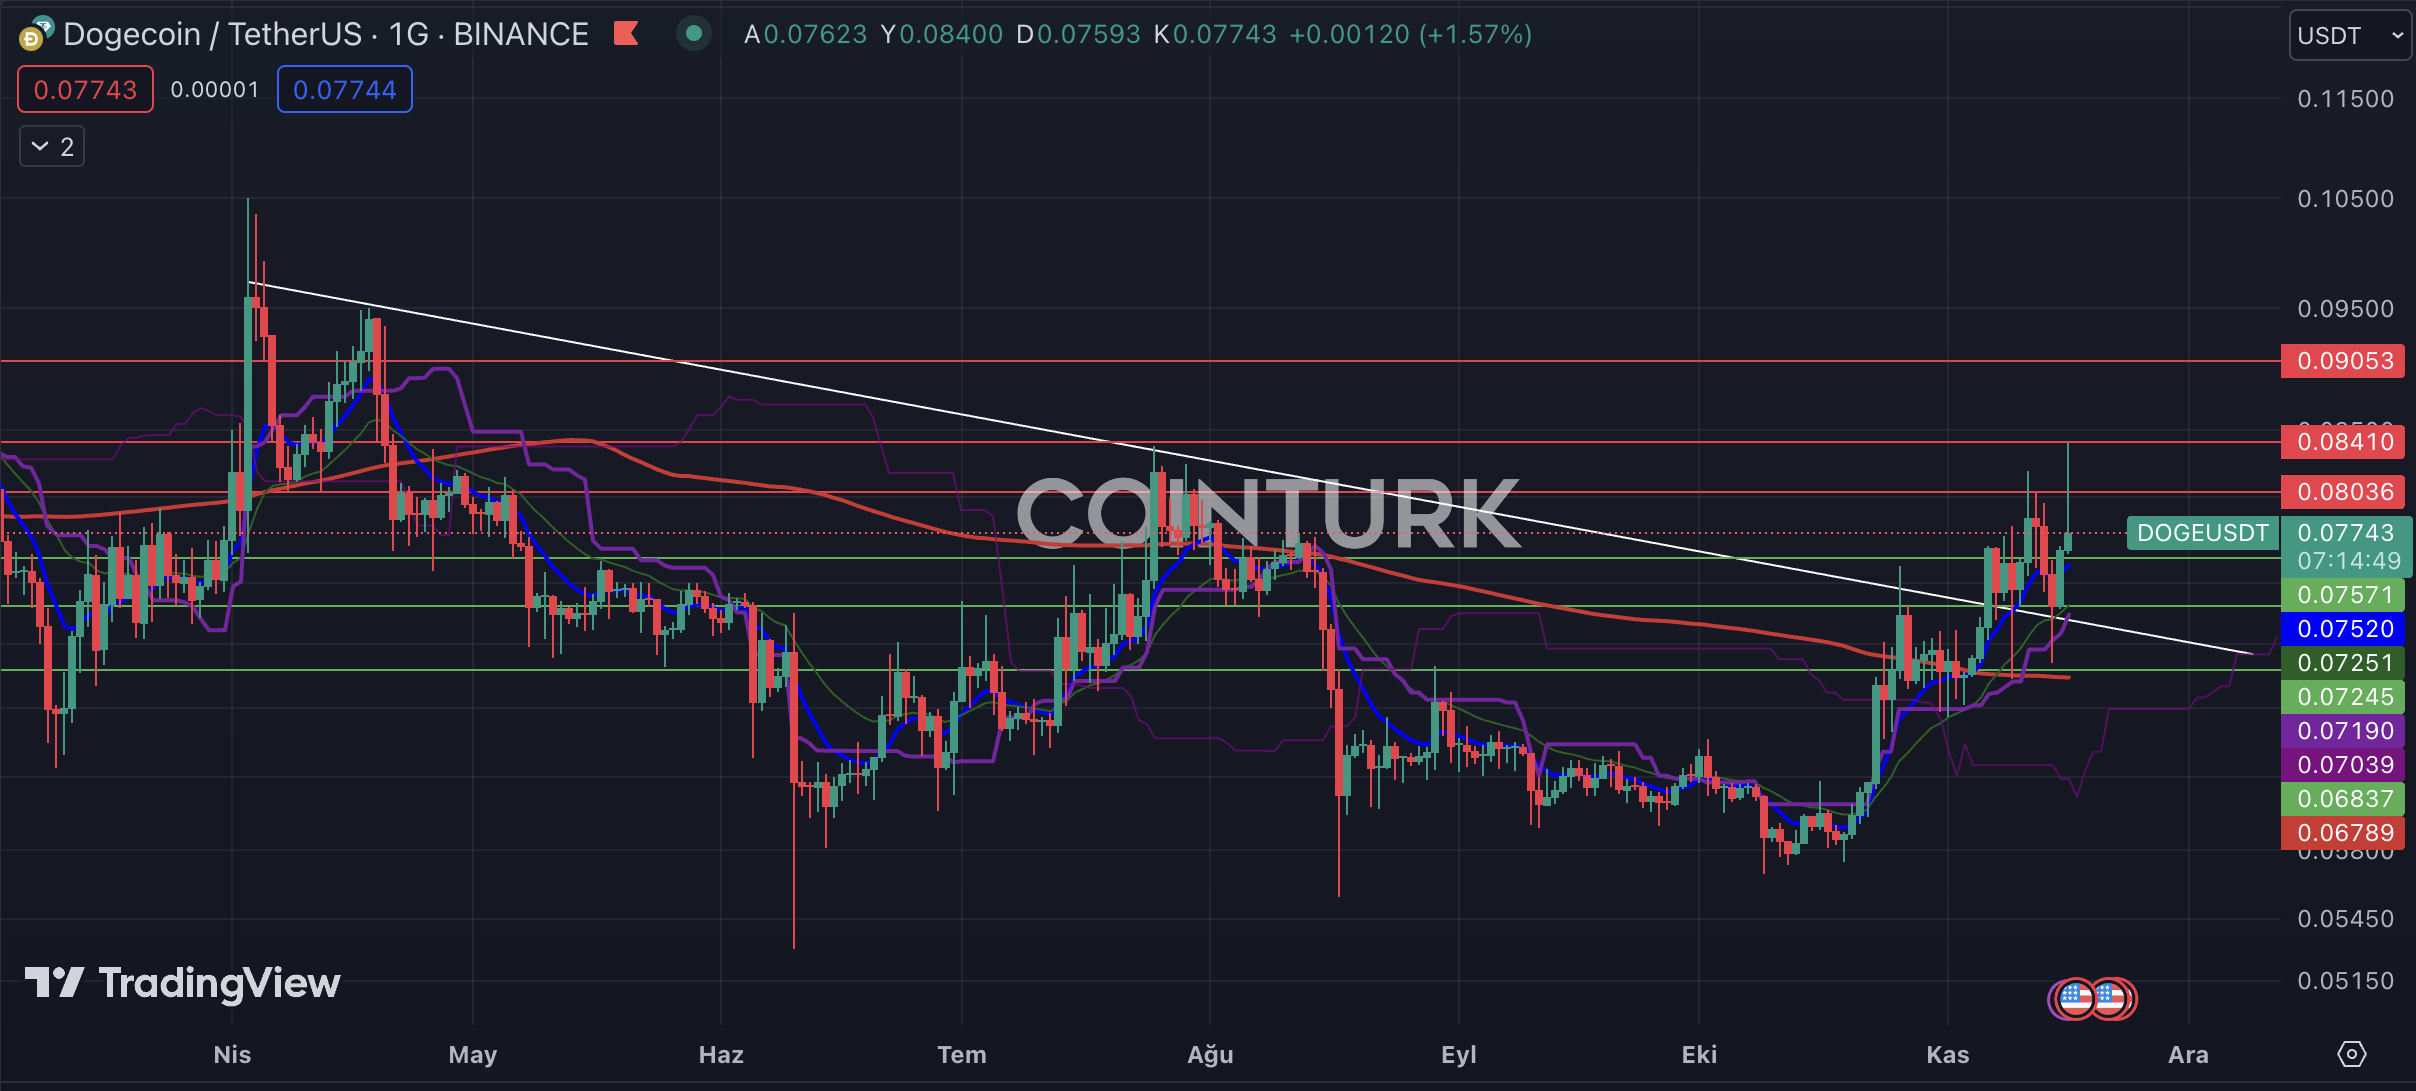
The first significant breakout on the Dogecoin daily chart is the recent break of the downtrend that has been ongoing since April. Although the price has made attempts, it has not been able to surpass the resistance levels and overcome the trendline. However, the role of this resistance line as support is an important factor for the DOGE price. Additionally, the EMA 200 (red line) acting as support is another notable aspect for DOGE.
Der erste bedeutende Ausbruch auf dem Dogecoin-Tages-Chart ist der jüngste Durchbruch des seit April andauernden Abwärtstrends. Obwohl der Preis Versuche unternommen hat, ist es ihm nicht gelungen, die Widerstandsniveaus zu überwinden und die Trendlinie zu überwinden. Allerdings ist die Rolle dieser Widerstandslinie als Unterstützung ein wichtiger Faktor für den DOGE-Preis. Darüber hinaus ist der als Unterstützung dienende EMA 200 (rote Linie) ein weiterer bemerkenswerter Aspekt für DOGE.
The important support levels to watch for DOGE are as follows: $0.07571, $0.07245, and $0.06837. Especially if the daily bar closes below $0.07245, the breakdown of the downtrend will become invalid and result in a loss of momentum for the DOGE price.
Die wichtigen Unterstützungsniveaus, die Sie für DOGE im Auge behalten sollten, sind wie folgt: 0,07571 $, 0,07245 $ und 0,06837 $. Insbesondere wenn der Tagesbalken unter 0,07245 US-Dollar schließt, wird der Zusammenbruch des Abwärtstrends ungültig und führt zu einem Schwungverlust für den DOGE-Preis.
The significant resistance levels to watch for DOGE are as follows: $0.08036, $0.08410, and $0.09053. In particular, if the daily bar closes above the $0.08410 level, it will help DOGE gain noticeable momentum.
Die wichtigsten Widerstandsniveaus für DOGE sind folgende: 0,08036 $, 0,08410 $ und 0,09053 $. Insbesondere wenn der Tagesbalken über dem Niveau von 0,08410 $ schließt, wird dies dazu beitragen, dass DOGE spürbar an Dynamik gewinnt.

Dogecoin Two-Hour Chart Analysis
Analyse des zweistündigen Dogecoin-Charts
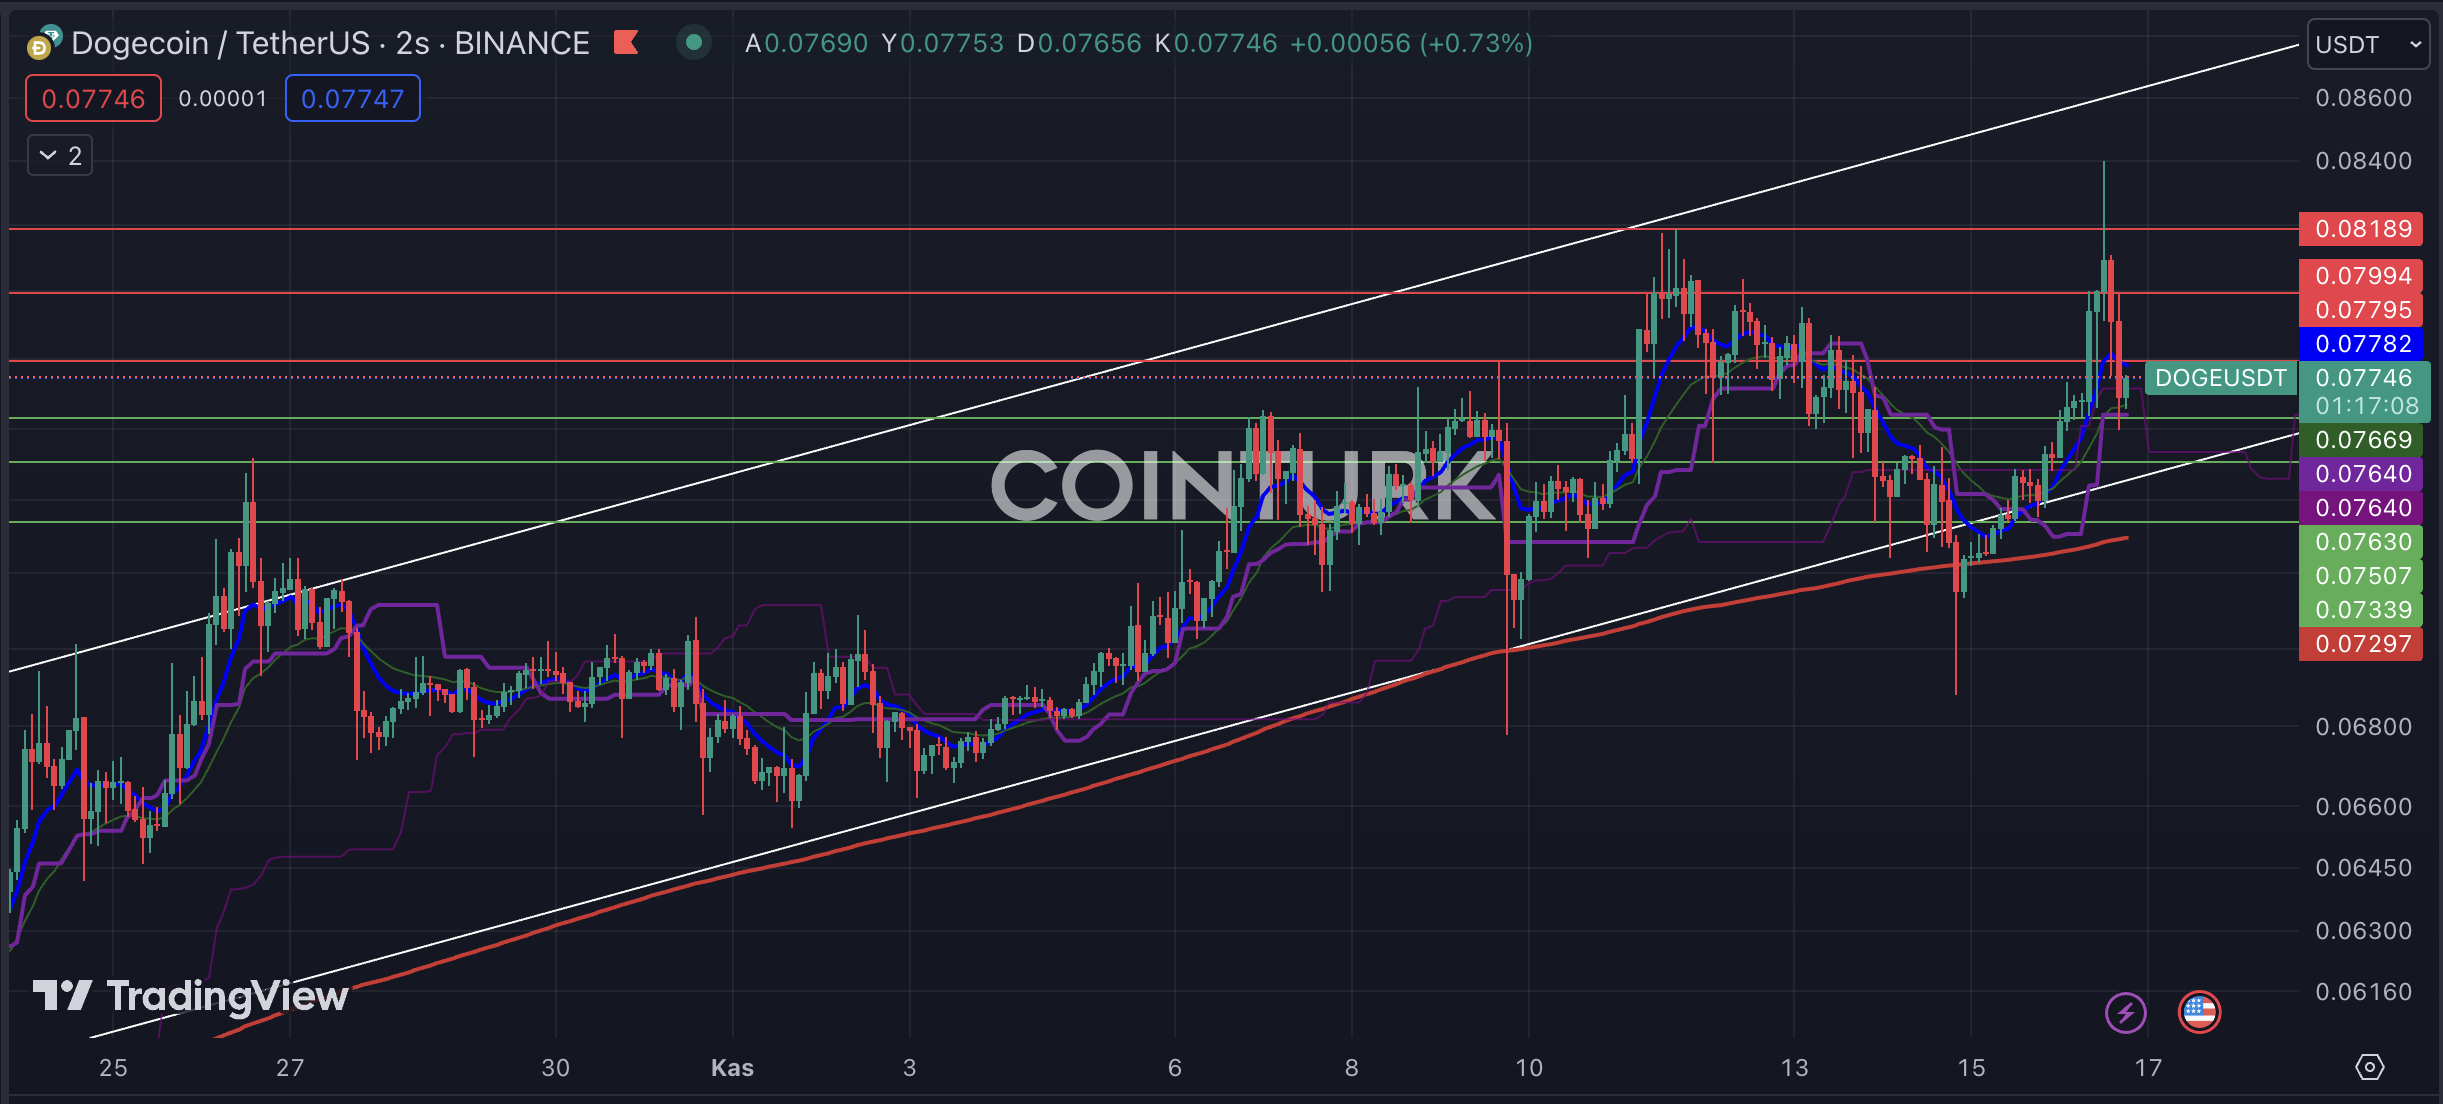
The first notable formation on the two-hour DOGE chart is the ascending channel formation. According to this formation, the price drops that occurred on November 10th and November 15th, dipping below the support line, remained as bear traps for DOGE. The support seen especially in the EMA 200 (red line) region has helped DOGE gain momentum.
Die erste bemerkenswerte Formation auf dem zweistündigen DOGE-Chart ist die aufsteigende Kanalformation. Dieser Formation zufolge blieben die Preisrückgänge vom 10. und 15. November, die unter die Unterstützungslinie fielen, eine Bärenfalle für DOGE. Die Unterstützung, die insbesondere im EMA 200-Bereich (rote Linie) zu beobachten ist, hat dazu beigetragen, dass DOGE an Dynamik gewinnt.
The important support levels to watch for DOGE are as follows: $0.07630, $0.07507, and $0.07339. Especially if the bar closes below $0.07339, it will invalidate the ascending channel formation and lead to a significant loss in DOGE price.
Die wichtigen Unterstützungsniveaus, die Sie für DOGE im Auge behalten sollten, sind wie folgt: 0,07630 $, 0,07507 $ und 0,07339 $. Insbesondere wenn der Balken unter 0,07339 US-Dollar schließt, wird die Bildung des aufsteigenden Kanals ungültig und es kommt zu einem erheblichen Verlust des DOGE-Preises.
The significant resistance levels to watch for DOGE are as follows: $0.07795, $0.07994, and $0.08189. In particular, if the bar closes above the $0.08189 level, it will help DOGE gain momentum.
Die wichtigsten Widerstandsniveaus für DOGE sind folgende: 0,07795 $, 0,07994 $ und 0,08189 $. Insbesondere wenn der Balken über dem Niveau von 0,08189 $ schließt, wird dies dazu beitragen, dass DOGE an Dynamik gewinnt.

Weiterlesen: https://en.coin-turk.com/dogecoin-technical-analysis-important-levels-to-watch/


 DogeHome
 CoinPedia News
 TheCoinrise Media
 BH NEWS
 COINTURK NEWS
 BlockchainReporter
 Crypto News Land
 Cryptopolitan_News


