Technical analysis is an essential indicator that investors, especially those trading in the futures market, need to constantly monitor in the cryptocurrency market. So what does technical analysis tell us about Dogecoin, which is currently trading at $0.07749? Let’s examine the detailed charts and important support and resistance levels.
テクニカル分析は、投資家、特に先物市場で取引する投資家が仮想通貨市場で常に監視する必要がある重要な指標です。それでは、テクニカル分析は現在0.07749ドルで取引されているドージコインについて何を教えてくれるのでしょうか?詳細なチャートと重要なサポートとレジスタンスのレベルを調べてみましょう。
Dogecoin Daily Chart Analysis
ドージコイン日足チャート分析
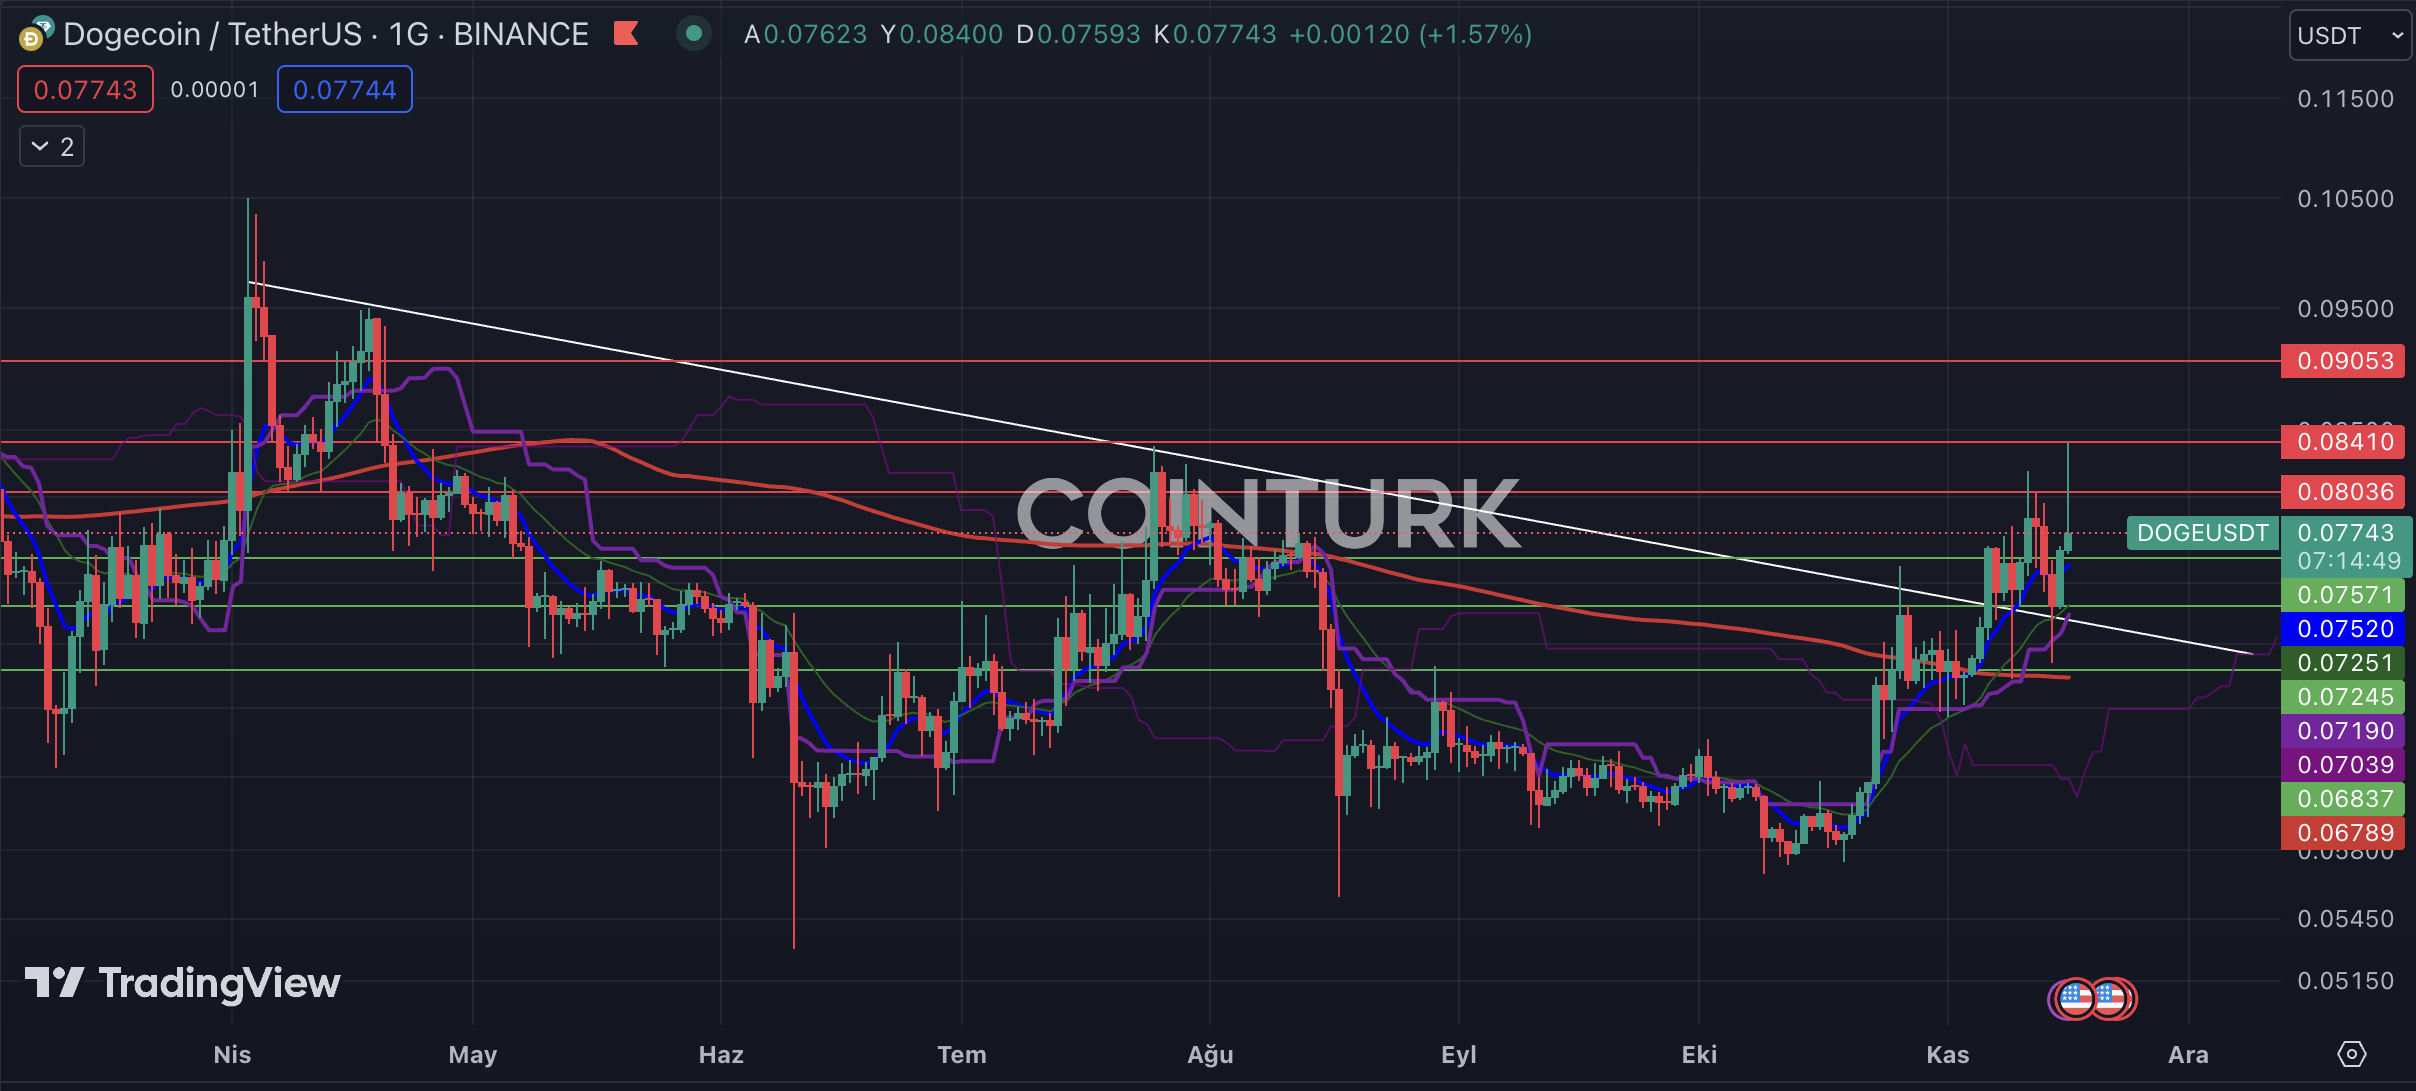
The first significant breakout on the Dogecoin daily chart is the recent break of the downtrend that has been ongoing since April. Although the price has made attempts, it has not been able to surpass the resistance levels and overcome the trendline. However, the role of this resistance line as support is an important factor for the DOGE price. Additionally, the EMA 200 (red line) acting as support is another notable aspect for DOGE.
ドージコインの日足チャートにおける最初の重要なブレイクアウトは、4月から続いている下降トレンドの最近のブレイクです。価格は試みを行ってきましたが、抵抗レベルを超えてトレンドラインを克服することはできませんでした。ただし、サポートとしてのこのレジスタンスラインの役割は、DOGE価格にとって重要な要素です。さらに、サポートとして機能する EMA 200 (赤線) も DOGE の注目すべき側面です。
The important support levels to watch for DOGE are as follows: $0.07571, $0.07245, and $0.06837. Especially if the daily bar closes below $0.07245, the breakdown of the downtrend will become invalid and result in a loss of momentum for the DOGE price.
DOGE で注目すべき重要なサポート レベルは次のとおりです: 0.07571 ドル、0.07245 ドル、0.06837 ドル。特に日足が0.07245ドルを下回って終了した場合、下降トレンドの内訳は無効になり、DOGE価格の勢いが失われることになります。
The significant resistance levels to watch for DOGE are as follows: $0.08036, $0.08410, and $0.09053. In particular, if the daily bar closes above the $0.08410 level, it will help DOGE gain noticeable momentum.
DOGE で注目すべき重要な抵抗レベルは次のとおりです: 0.08036 ドル、0.08410 ドル、0.09053 ドル。特に、日足が0.08410ドルのレベルを超えて終了すると、DOGEが顕著な勢いを得るのに役立ちます。

Dogecoin Two-Hour Chart Analysis
ドージコインの2時間足チャート分析
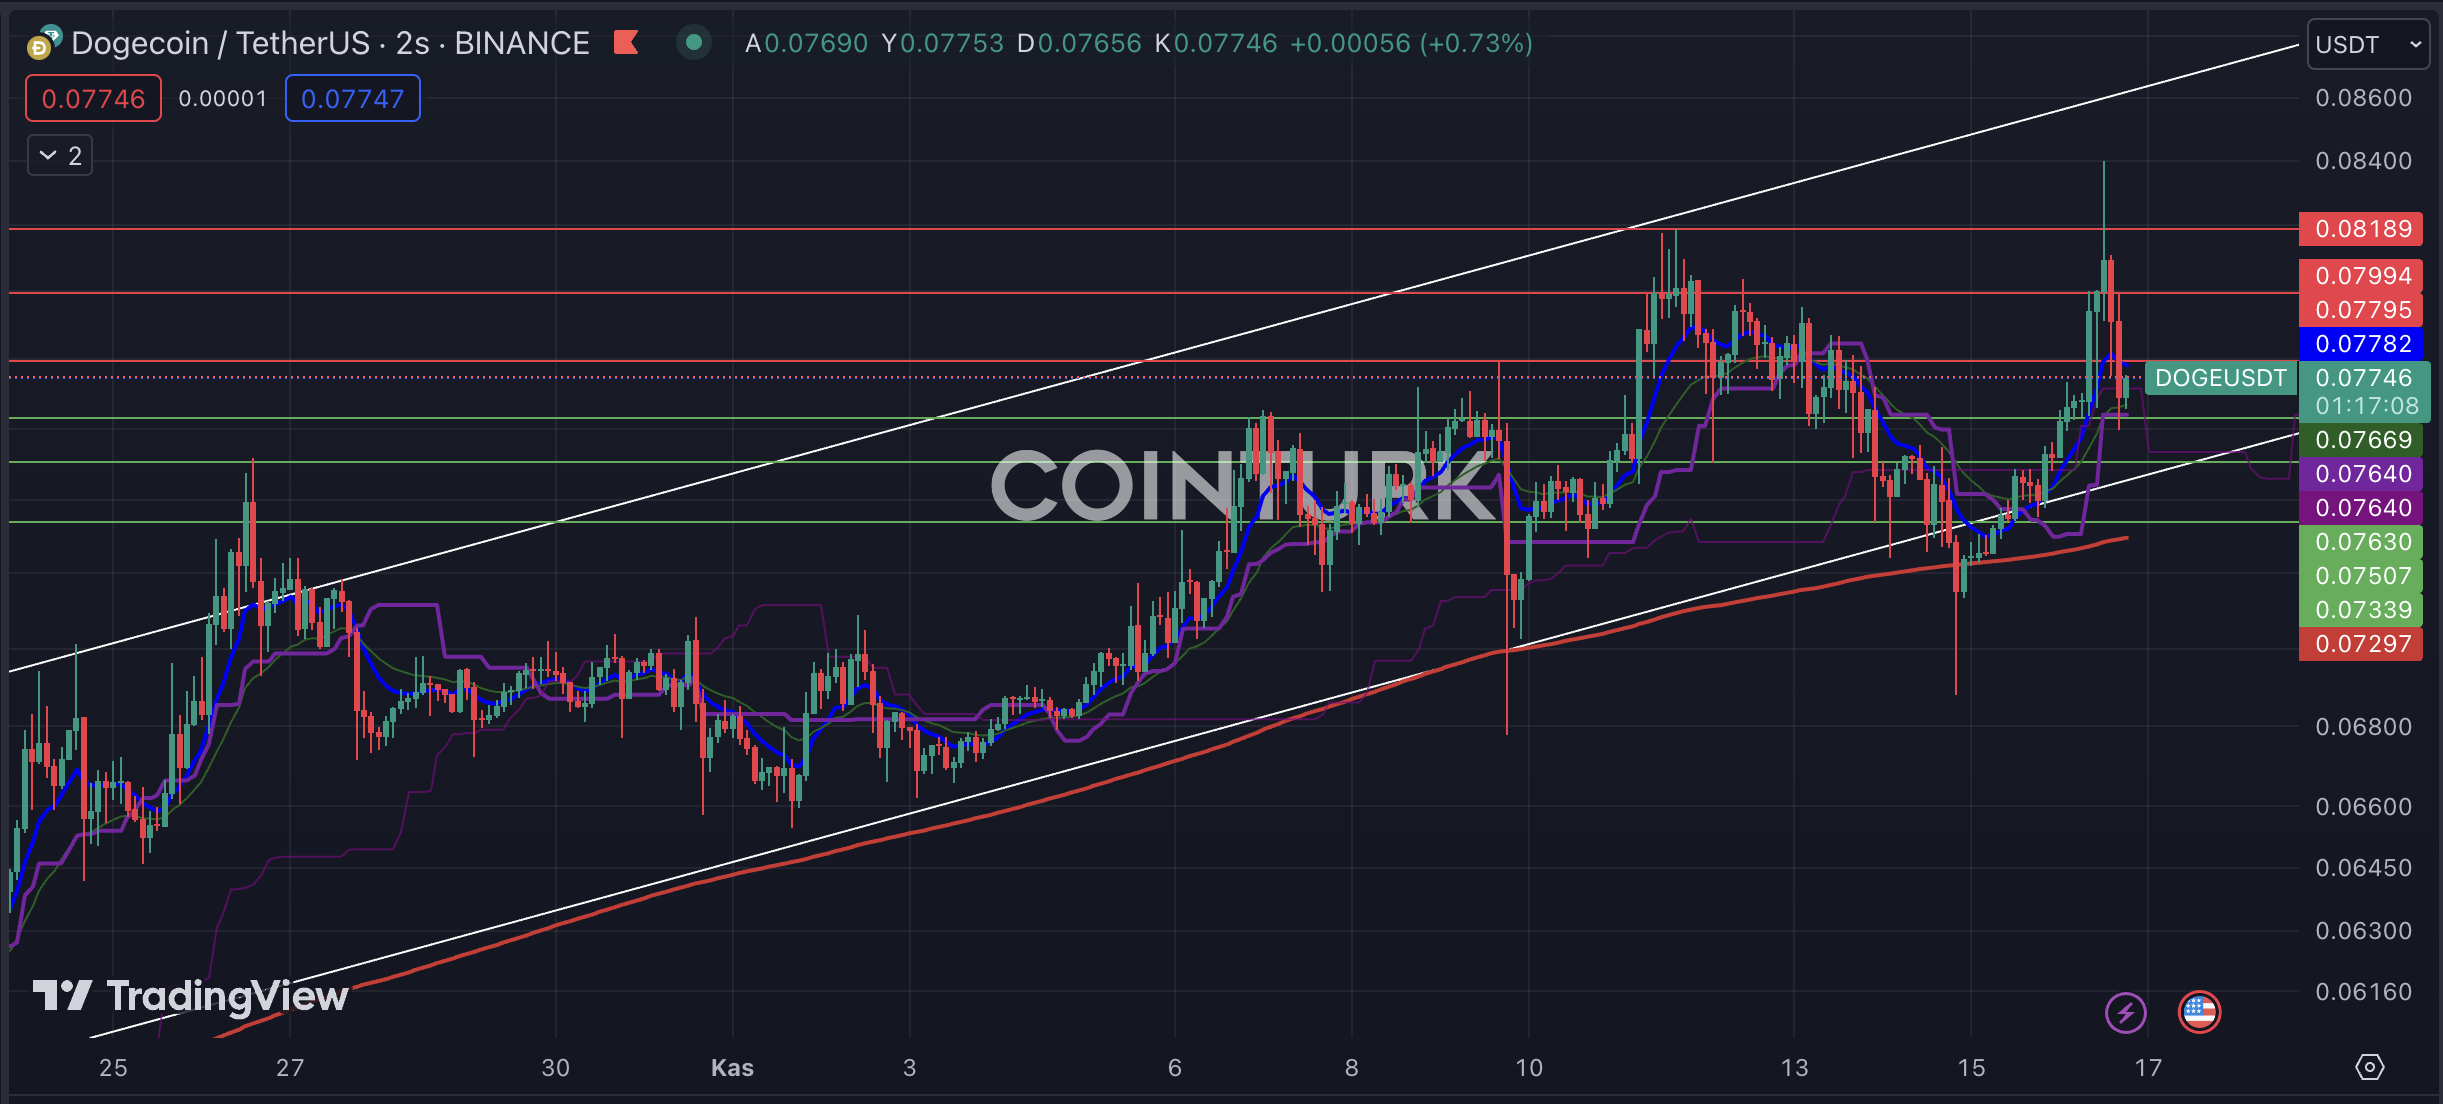
The first notable formation on the two-hour DOGE chart is the ascending channel formation. According to this formation, the price drops that occurred on November 10th and November 15th, dipping below the support line, remained as bear traps for DOGE. The support seen especially in the EMA 200 (red line) region has helped DOGE gain momentum.
2 時間足 DOGE チャートの最初の注目すべきフォーメーションは、上昇チャネルのフォーメーションです。このフォーメーションによれば、11月10日と11月15日に発生したサポートラインを下回る価格下落は、DOGEにとってベアトラップとして残りました。特にEMA 200(赤線)地域で見られるサポートは、DOGEの勢いを高めるのに役立ちました。
The important support levels to watch for DOGE are as follows: $0.07630, $0.07507, and $0.07339. Especially if the bar closes below $0.07339, it will invalidate the ascending channel formation and lead to a significant loss in DOGE price.
DOGE で注目すべき重要なサポート レベルは次のとおりです: 0.07630 ドル、0.07507 ドル、0.07339 ドル。特にバーが0.07339ドルを下回って終了すると、上昇チャネル形成が無効になり、DOGE価格の大幅な損失につながります。
The significant resistance levels to watch for DOGE are as follows: $0.07795, $0.07994, and $0.08189. In particular, if the bar closes above the $0.08189 level, it will help DOGE gain momentum.
DOGE で注目すべき重要な抵抗レベルは次のとおりです: 0.07795 ドル、0.07994 ドル、0.08189 ドル。特に、バーが0.08189ドルのレベルを超えて終了すると、DOGEが勢いを増すのに役立ちます。

続きを読む: https://en.coin-turk.com/dogecoin-technical-analysis- important-levels-to-watch/


 BlockchainReporter
 Crypto News Land
 Cryptopolitan_News
 DogeHome
 TheCoinrise Media
 Crypto Front News
 BlockchainReporter
 Thecoinrepublic.com


