Technical analysis is an essential indicator that investors, especially those trading in the futures market, need to constantly monitor in the cryptocurrency market. So what does technical analysis tell us about Dogecoin, which is currently trading at $0.07749? Let’s examine the detailed charts and important support and resistance levels.
技术分析是投资者,尤其是期货市场交易者在加密货币市场中需要持续监控的重要指标。那么,对于目前交易价格为 0.07749 美元的狗狗币,技术分析告诉我们什么呢?让我们看一下详细的图表以及重要的支撑位和阻力位。
Dogecoin Daily Chart Analysis
狗狗币每日图表分析
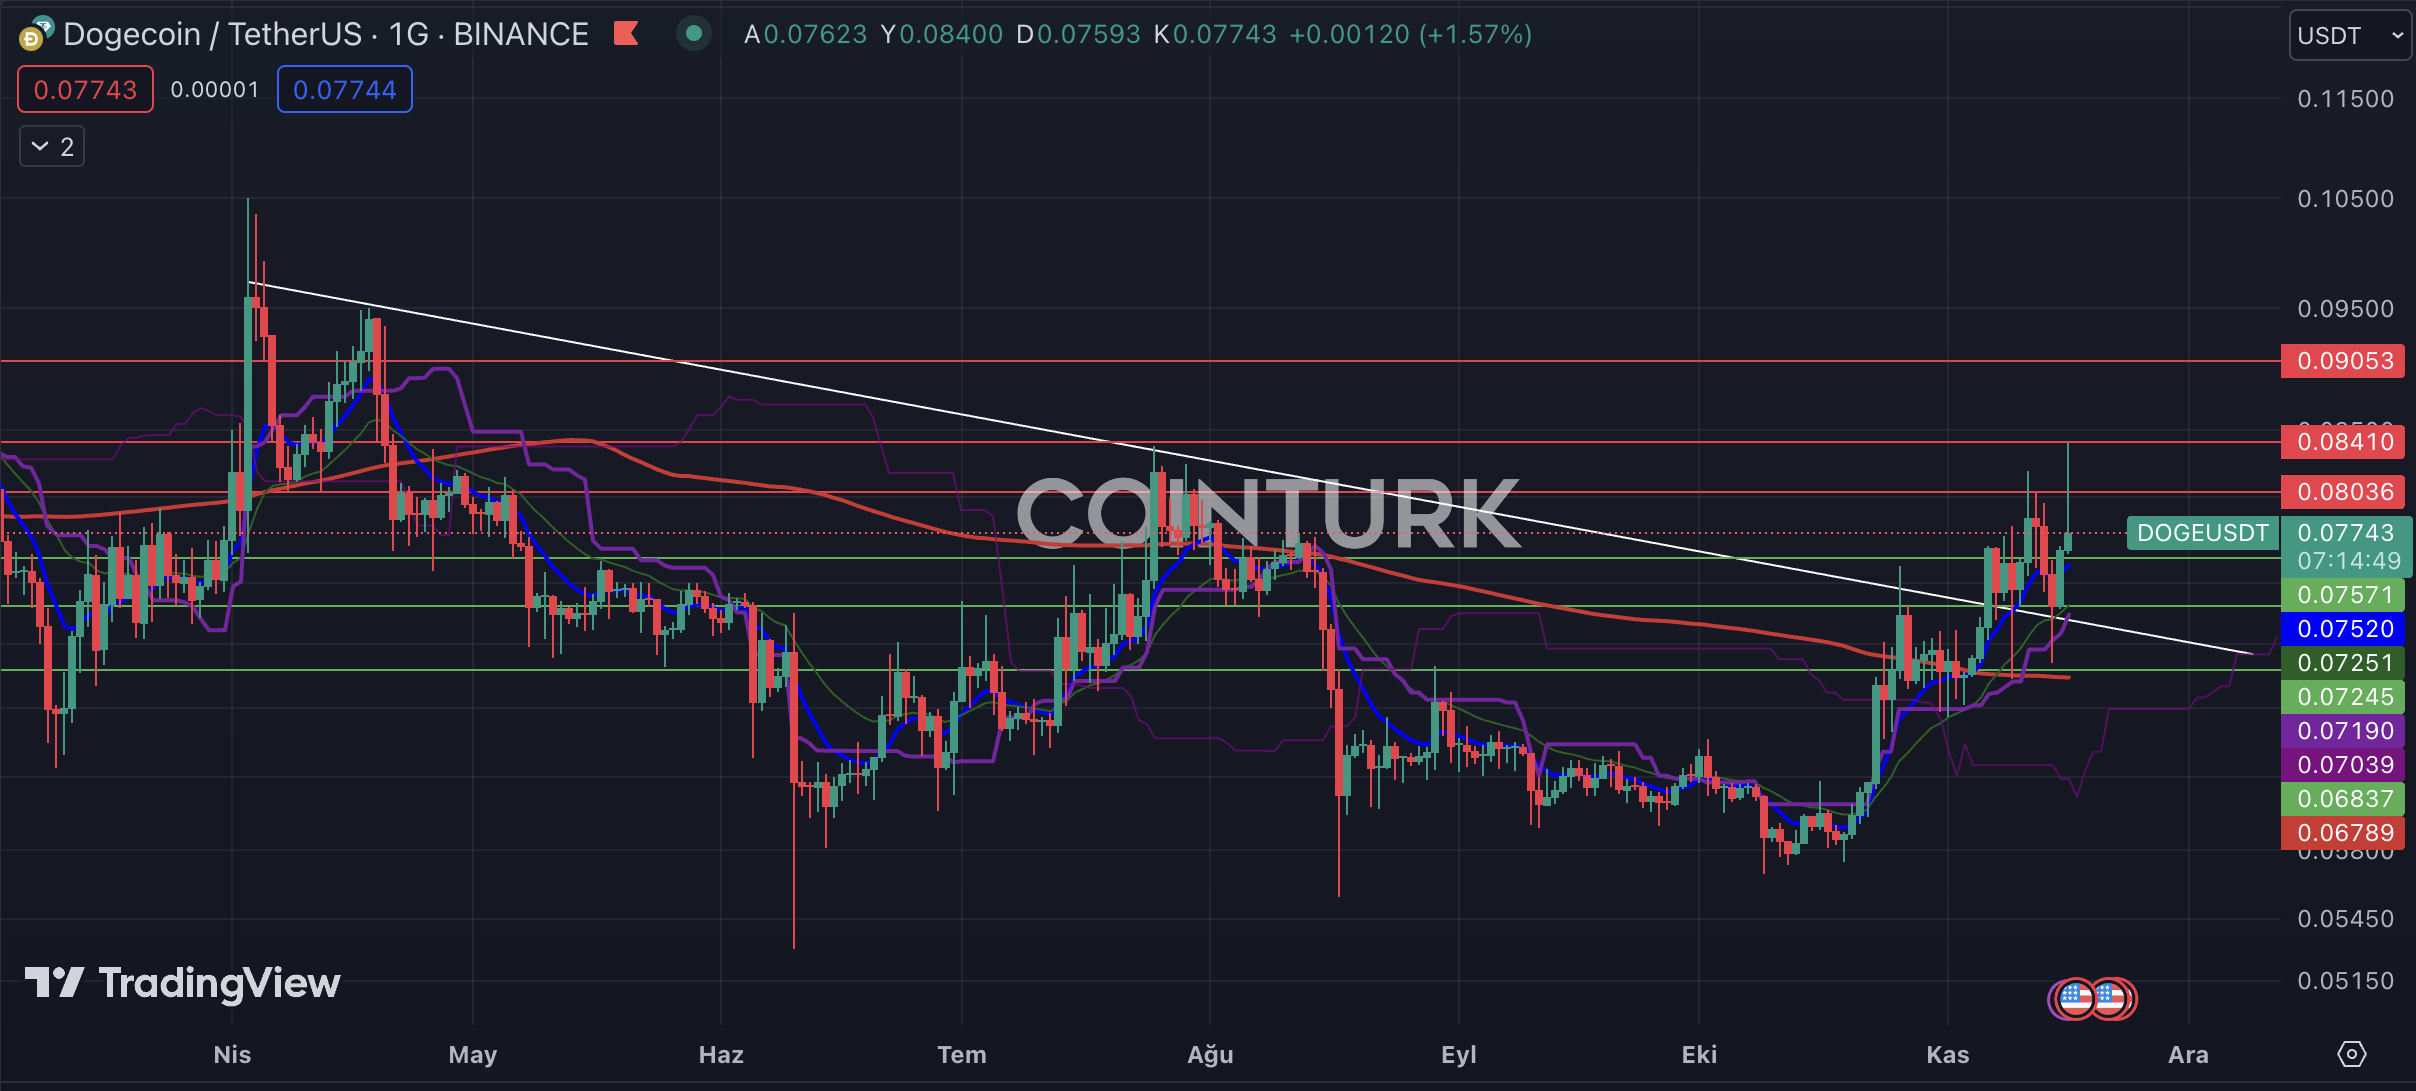
The first significant breakout on the Dogecoin daily chart is the recent break of the downtrend that has been ongoing since April. Although the price has made attempts, it has not been able to surpass the resistance levels and overcome the trendline. However, the role of this resistance line as support is an important factor for the DOGE price. Additionally, the EMA 200 (red line) acting as support is another notable aspect for DOGE.
狗狗币日线图上的第一个重大突破是最近突破了自四月份以来一直持续的下降趋势。尽管价格做出了尝试,但未能突破阻力位并突破趋势线。然而,这条阻力线作为支撑的作用是影响DOGE价格的重要因素。此外,作为支撑的 EMA 200(红线)是 DOGE 的另一个值得注意的方面。
The important support levels to watch for DOGE are as follows: $0.07571, $0.07245, and $0.06837. Especially if the daily bar closes below $0.07245, the breakdown of the downtrend will become invalid and result in a loss of momentum for the DOGE price.
DOGE 值得关注的重要支撑位如下:0.07571 美元、0.07245 美元和 0.06837 美元。特别是如果日线收盘价低于 0.07245 美元,则下跌趋势的突破将变得无效,并导致 DOGE 价格失去动力。
The significant resistance levels to watch for DOGE are as follows: $0.08036, $0.08410, and $0.09053. In particular, if the daily bar closes above the $0.08410 level, it will help DOGE gain noticeable momentum.
DOGE 值得关注的重要阻力位如下:0.08036 美元、0.08410 美元和 0.09053 美元。特别是,如果日线收于 0.08410 美元上方,将有助于 DOGE 获得明显的动力。

Dogecoin Two-Hour Chart Analysis
狗狗币两小时图分析
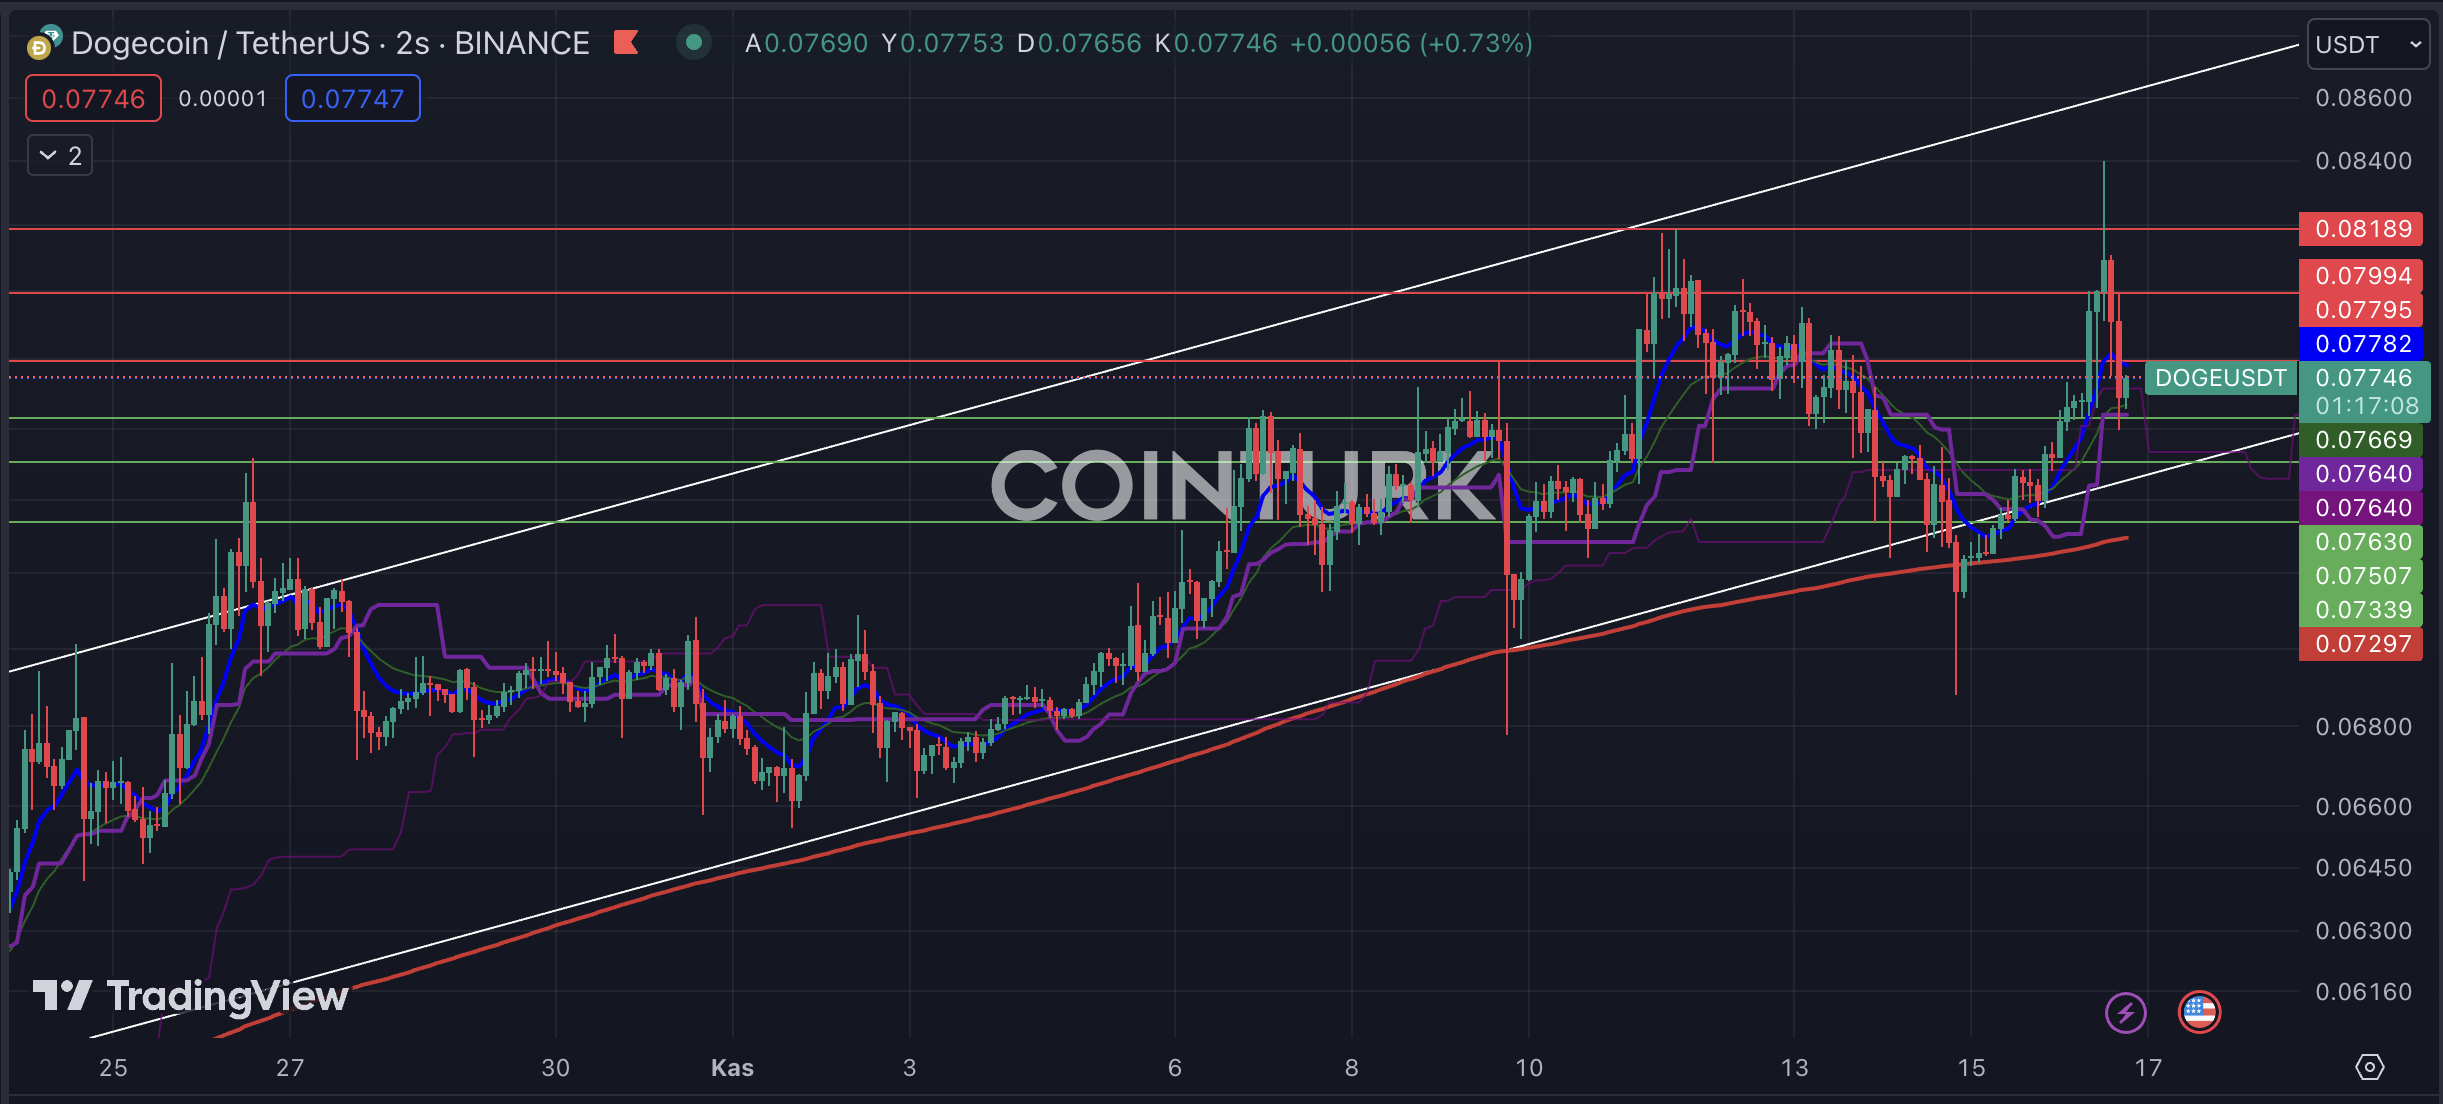
The first notable formation on the two-hour DOGE chart is the ascending channel formation. According to this formation, the price drops that occurred on November 10th and November 15th, dipping below the support line, remained as bear traps for DOGE. The support seen especially in the EMA 200 (red line) region has helped DOGE gain momentum.
两小时 DOGE 图表上第一个值得注意的形态是上升通道形态。根据该形态,11 月 10 日和 11 月 15 日发生的价格下跌,跌破支撑线,仍然是 DOGE 的空头陷阱。特别是在 EMA 200(红线)区域看到的支撑帮助 DOGE 获得了动力。
The important support levels to watch for DOGE are as follows: $0.07630, $0.07507, and $0.07339. Especially if the bar closes below $0.07339, it will invalidate the ascending channel formation and lead to a significant loss in DOGE price.
DOGE 值得关注的重要支撑位如下:0.07630 美元、0.07507 美元和 0.07339 美元。特别是如果收盘价低于 0.07339 美元,则上升通道形成无效并导致 DOGE 价格大幅下跌。
The significant resistance levels to watch for DOGE are as follows: $0.07795, $0.07994, and $0.08189. In particular, if the bar closes above the $0.08189 level, it will help DOGE gain momentum.
DOGE 值得关注的重要阻力位如下:0.07795 美元、0.07994 美元和 0.08189 美元。特别是,如果收盘价高于 0.08189 美元,将有助于 DOGE 获得动力。

继续阅读:https://en.coin-turk.com/dogecoin-technical-analysis-important-levels-to-watch/


 Optimisus
 COINTURK NEWS
 BH NEWS
 BlockchainReporter
 DogeHome
 U_Today
 U_Today
 Optimisus
 Crypto Front News


