Technical analysis is an essential indicator that investors, especially those trading in the futures market, need to constantly monitor in the cryptocurrency market. So what does technical analysis tell us about Dogecoin, which is currently trading at $0.07749? Let’s examine the detailed charts and important support and resistance levels.
기술적 분석은 투자자, 특히 선물시장 거래자가 암호화폐 시장을 지속적으로 모니터링해야 하는 필수 지표입니다. 그렇다면 현재 0.07749달러에 거래되고 있는 Dogecoin에 대해 기술적 분석을 통해 우리는 무엇을 알 수 있을까요? 자세한 차트와 중요한 지지 및 저항 수준을 살펴보겠습니다.
Dogecoin Daily Chart Analysis
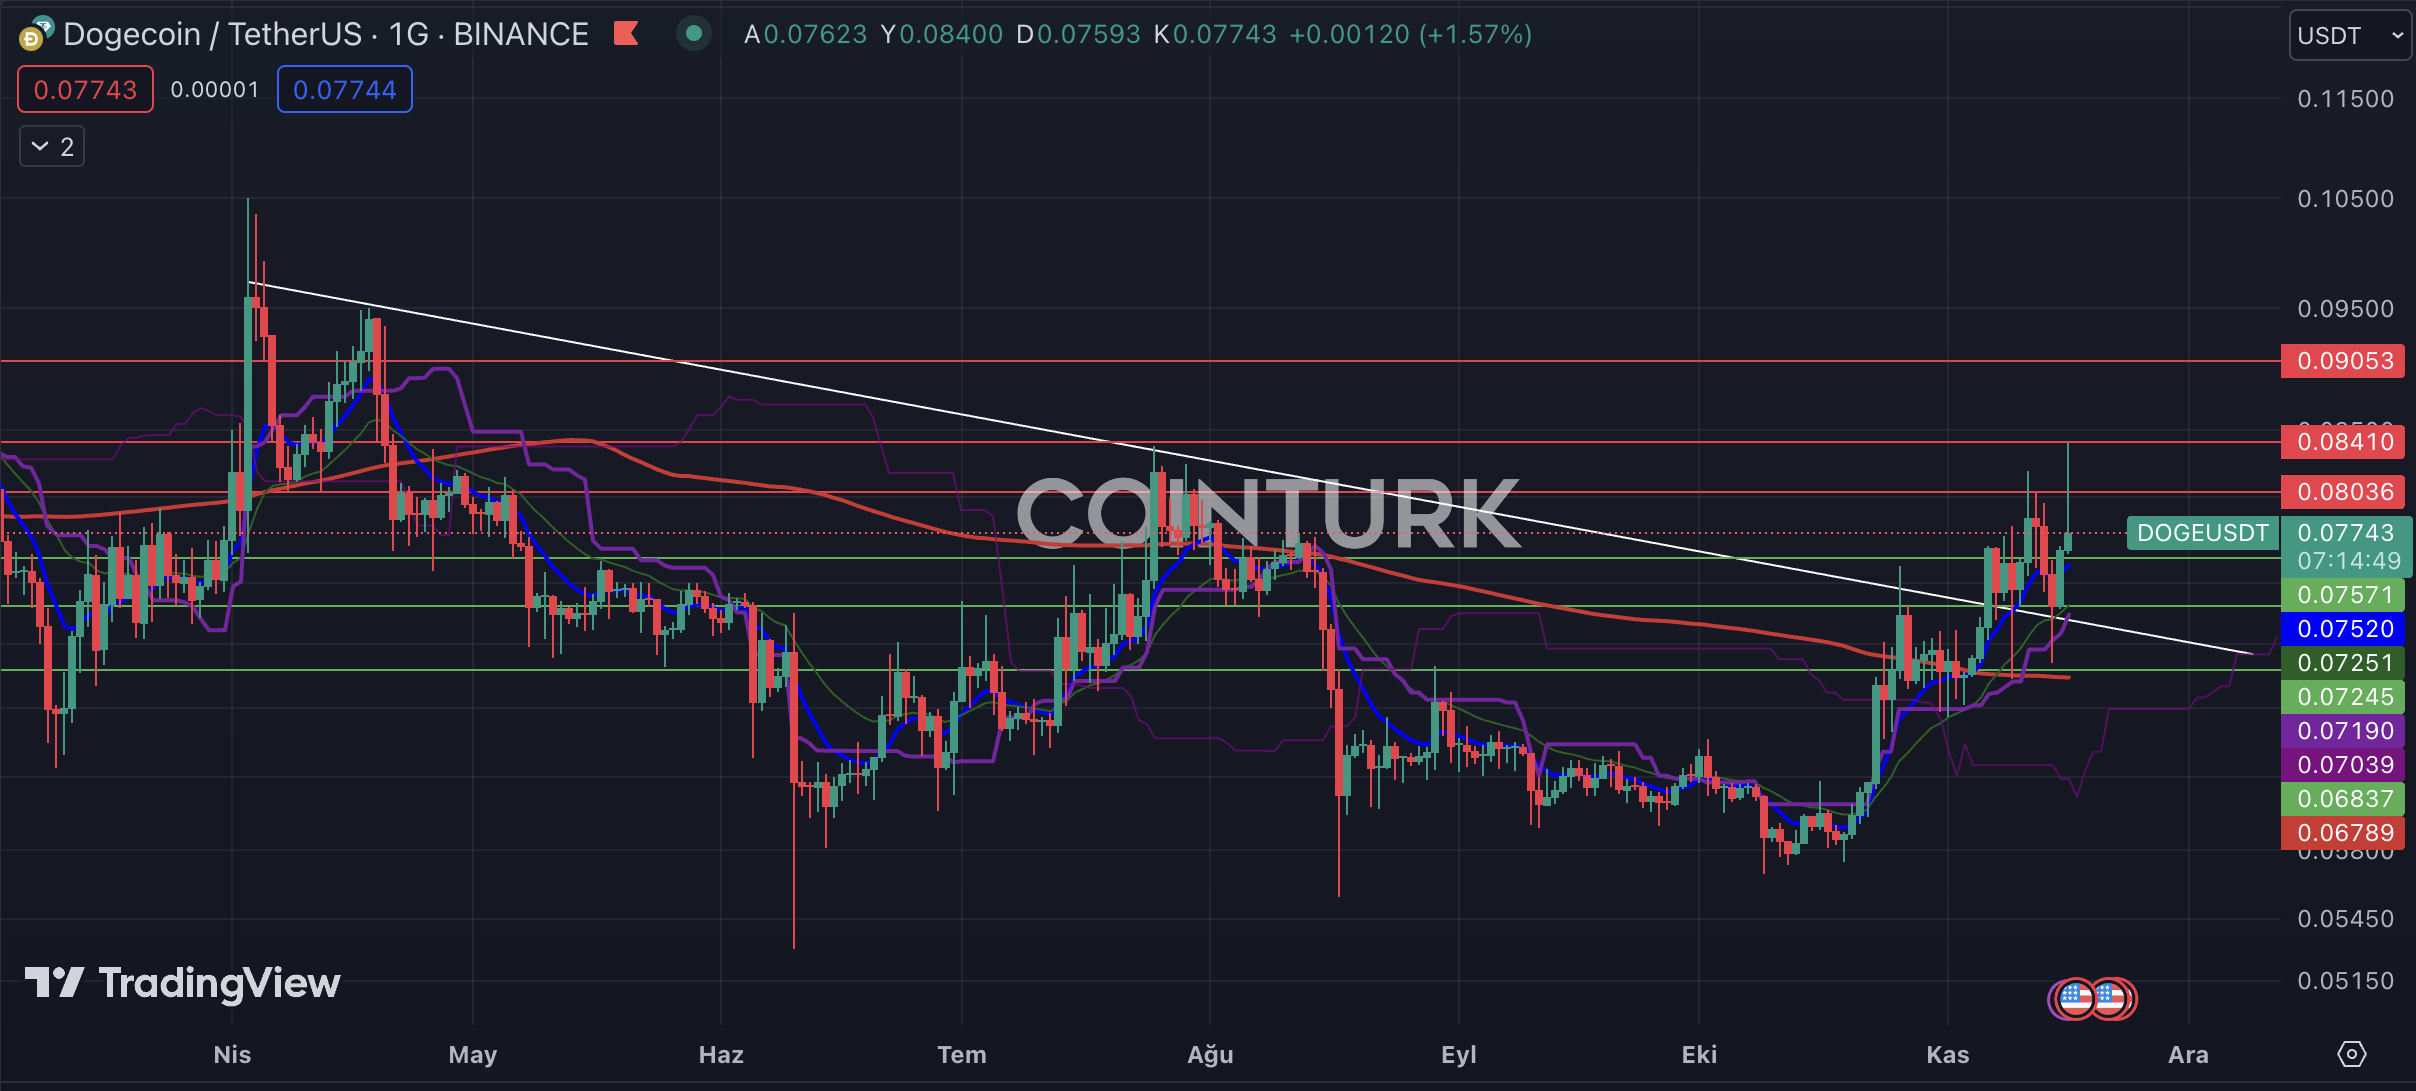
The first significant breakout on the Dogecoin daily chart is the recent break of the downtrend that has been ongoing since April. Although the price has made attempts, it has not been able to surpass the resistance levels and overcome the trendline. However, the role of this resistance line as support is an important factor for the DOGE price. Additionally, the EMA 200 (red line) acting as support is another notable aspect for DOGE.
Dogecoin 일일 차트의 첫 번째 중요한 돌파는 4월부터 지속되어 온 하락 추세가 최근에 중단된 것입니다. 가격은 여러 시도를 했으나 저항선을 넘지 못하고 추세선을 극복하지 못했습니다. 그러나 이 저항선의 지지선 역할은 DOGE 가격에 중요한 요소입니다. 또한 지원 역할을 하는 EMA 200(빨간색 선)은 DOGE의 또 다른 주목할만한 측면입니다.
The important support levels to watch for DOGE are as follows: $0.07571, $0.07245, and $0.06837. Especially if the daily bar closes below $0.07245, the breakdown of the downtrend will become invalid and result in a loss of momentum for the DOGE price.
DOGE를 주목해야 할 중요한 지원 수준은 $0.07571, $0.07245 및 $0.06837입니다. 특히 일일 막대가 $0.07245 아래로 마감되면 하락세 분석이 무효화되고 DOGE 가격의 모멘텀이 상실됩니다.
The significant resistance levels to watch for DOGE are as follows: $0.08036, $0.08410, and $0.09053. In particular, if the daily bar closes above the $0.08410 level, it will help DOGE gain noticeable momentum.
DOGE를 관찰할 중요한 저항 수준은 $0.08036, $0.08410, $0.09053입니다. 특히 일일 막대가 $0.08410 수준 이상으로 마감되면 DOGE가 눈에 띄는 추진력을 얻는 데 도움이 될 것입니다.

Dogecoin Two-Hour Chart Analysis
Dogecoin 2시간 차트 분석
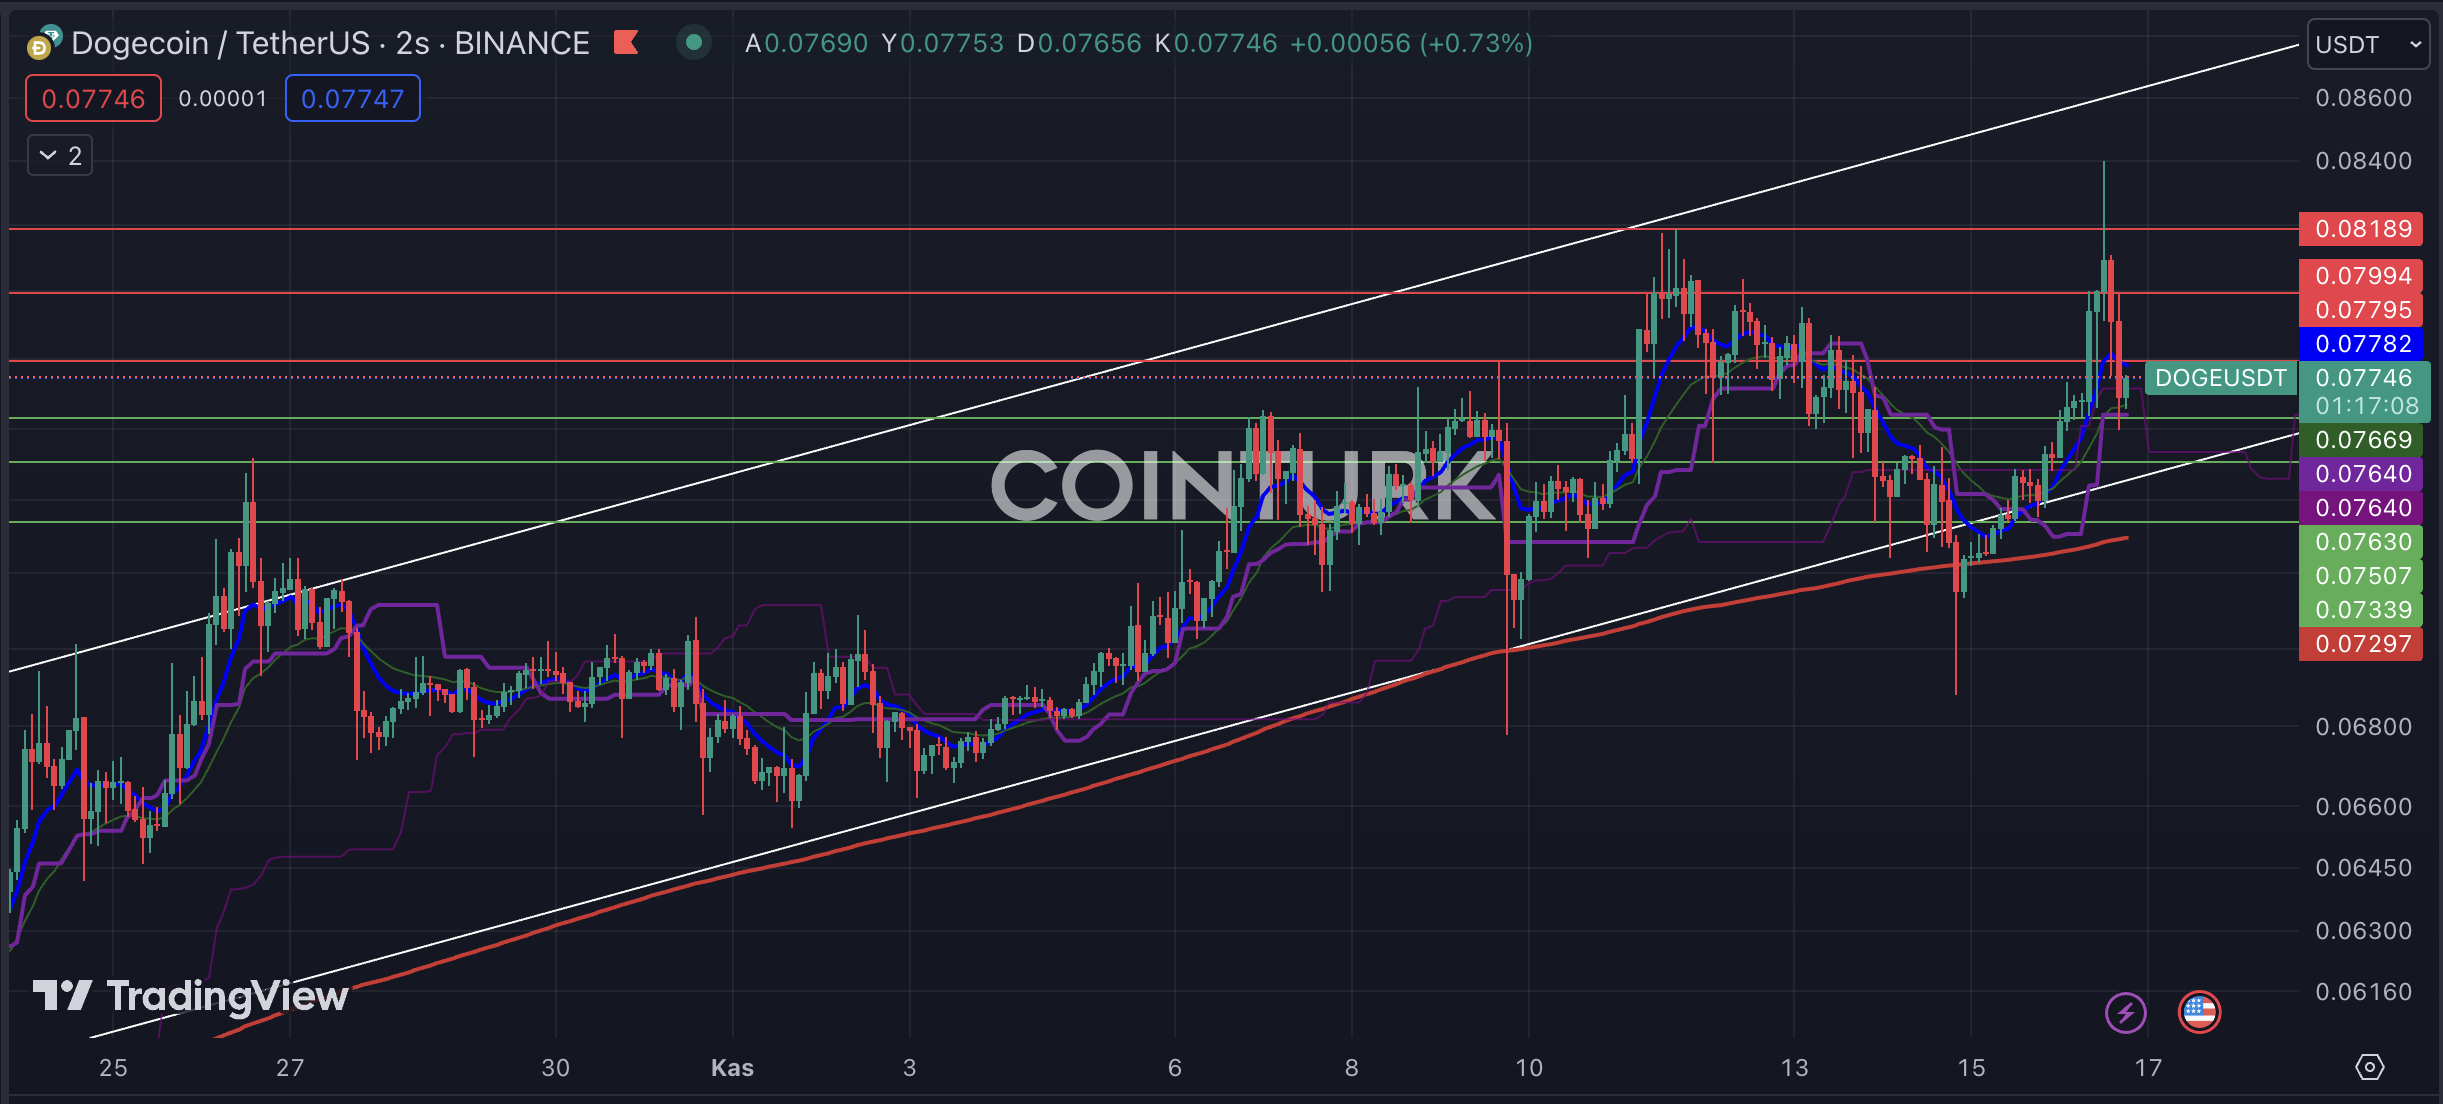
The first notable formation on the two-hour DOGE chart is the ascending channel formation. According to this formation, the price drops that occurred on November 10th and November 15th, dipping below the support line, remained as bear traps for DOGE. The support seen especially in the EMA 200 (red line) region has helped DOGE gain momentum.
The important support levels to watch for DOGE are as follows: $0.07630, $0.07507, and $0.07339. Especially if the bar closes below $0.07339, it will invalidate the ascending channel formation and lead to a significant loss in DOGE price.
DOGE를 주목해야 할 중요한 지원 수준은 $0.07630, $0.07507 및 $0.07339입니다. 특히 바가 $0.07339 아래로 마감되면 상승 채널 형성이 무효화되고 DOGE 가격이 크게 손실됩니다.
The significant resistance levels to watch for DOGE are as follows: $0.07795, $0.07994, and $0.08189. In particular, if the bar closes above the $0.08189 level, it will help DOGE gain momentum.
DOGE를 관찰할 중요한 저항 수준은 $0.07795, $0.07994 및 $0.08189입니다. 특히, 막대가 $0.08189 수준 이상으로 마감되면 DOGE가 추진력을 얻는 데 도움이 될 것입니다.

계속 읽기: https://en.coin-turk.com/dogecoin-technical-analytic-important-levels-to-watch/


 Cointribune
 CoinPedia News
 CoinoMedia
 CoinEagle.com
 DogeHome
 Cointelegraph
 Cryptopolitan_News
 Optimisus
 Thecoinrepublic.com


