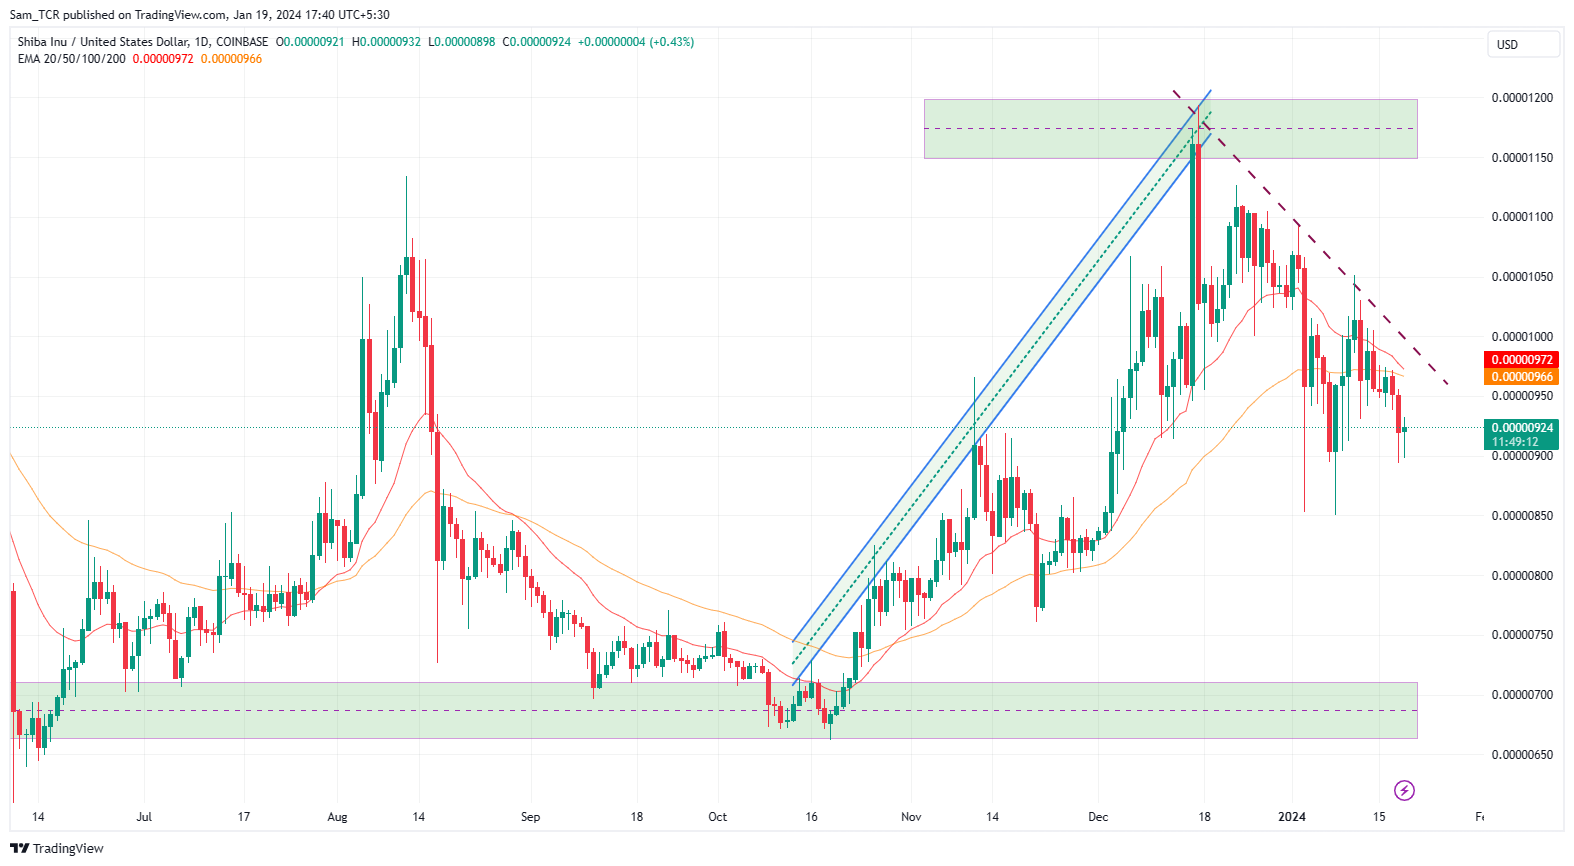
- 1 The SHIB crypto asset is showing bearishness and declined sharply from the supply region.
- 2 The analysis of the major indicators and trend-based tools confirm a bearish outlook.
1 Das SHIB-Krypto-Asset zeigt einen Abwärtstrend und ist gegenüber dem Angebotsbereich stark zurückgegangen.
2 Die Analyse der wichtigsten Indikatoren und trendbasierten Tools bestätigt einen pessimistischen Ausblick.
SHIB is a crypto that was born from memes and aims to be a project run by the community. It is based on Ethereum and is directly a rival to Dogecoin (DOGE). Its symbol is made out of a Shiba Inu, and that is a type of dog from Japan.
SHIB ist eine Kryptowährung, die aus Memes entstanden ist und ein von der Community betriebenes Projekt sein soll. Es basiert auf Ethereum und ist ein direkter Konkurrent von Dogecoin (DOGE). Sein Symbol besteht aus einem Shiba Inu, einer Hundeart aus Japan.
Shiba Inu was developed in August 2020 by an anonymous and unknown person called Ryoshi. Ryoshi then gave the meme crypto to its community, which has kept developing the Shiba Inu ecosystem.
Shiba Inu wurde im August 2020 von einer anonymen und unbekannten Person namens Ryoshi entwickelt. Anschließend übergab Ryoshi die Meme-Kryptowährung an seine Community, die das Shiba-Inu-Ökosystem weiterentwickelte.
Ryoshi said that SHIB was an “experiment in decentralized spontaneous community building”, and since then, the crypto has reached over one million holders on the Ethereum network. Ryoshi further says that the Shiba Inu crypto’s ecosystem was created on Ethereum because it was a safe option.
Ryoshi sagte, SHIB sei ein „Experiment zum dezentralen, spontanen Community-Aufbau“ und seitdem habe die Kryptowährung über eine Million Inhaber im Ethereum-Netzwerk erreicht. Ryoshi sagt weiter, dass das Shiba-Inu-Krypto-Ökosystem auf Ethereum geschaffen wurde, weil es eine sichere Option sei.
Can SHIBA INU Fall Like a Sharp Knife Soon
Kann SHIBA INU bald wie ein scharfes Messer fallen?

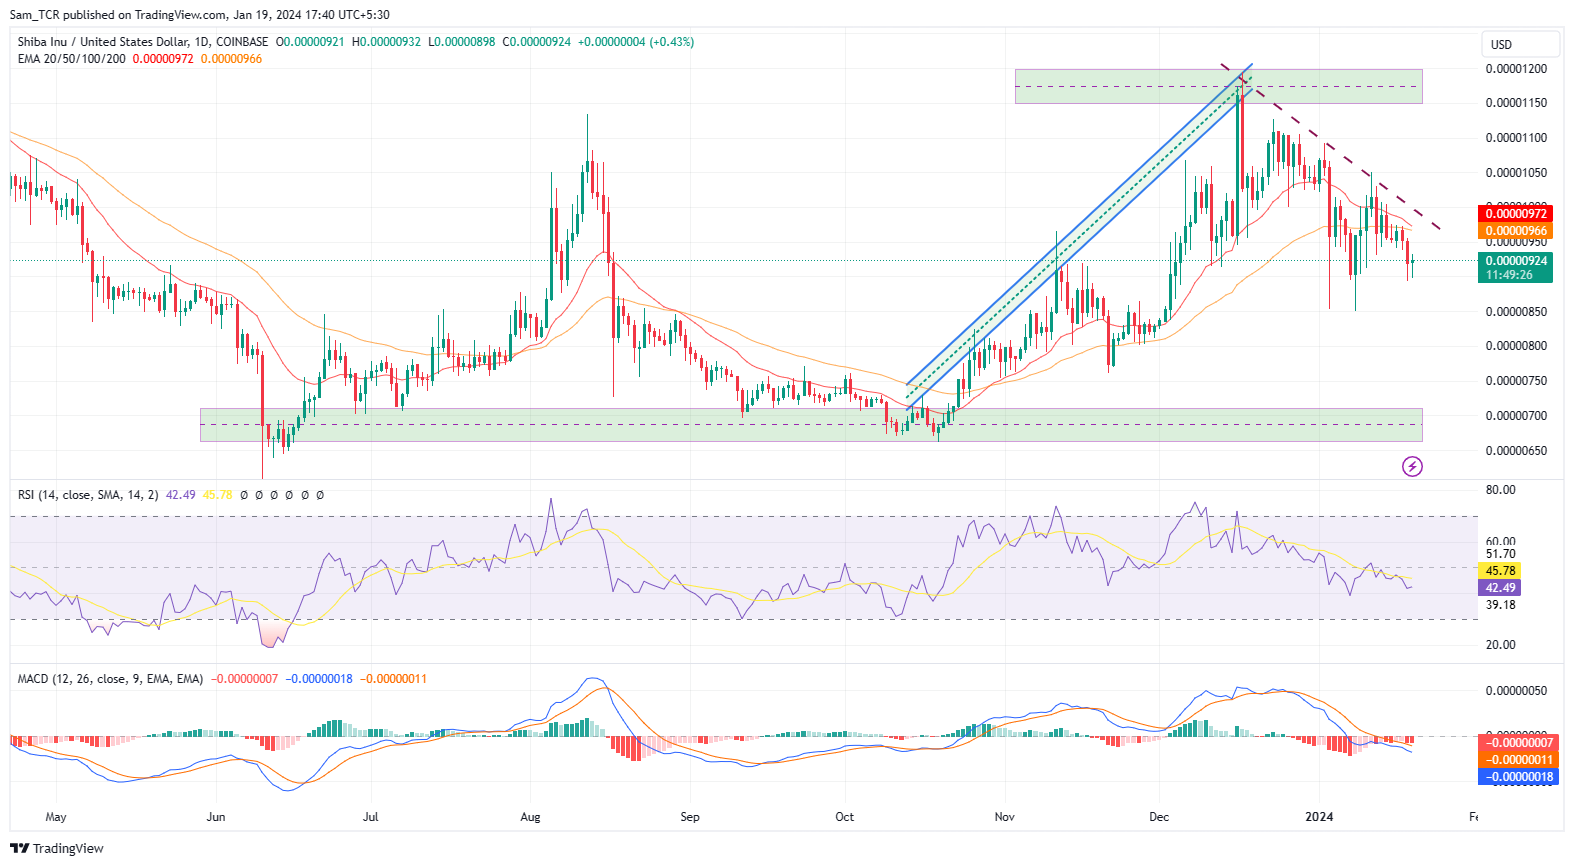
The SHIB crypto asset is showing bearishness and falling potential as it declines from the supply region at $0.00001150 which is below the major trend 20, and 50-Day EMAs, which is influenced directly by the seller’s surge, and could slump more downward to reach below level.
Das SHIB-Krypto-Asset zeigt Abwärtstrend und Abwärtspotenzial, da es aus dem Angebotsbereich bei 0,00001150 US-Dollar fällt, was unter dem Haupttrend der 20- und 50-Tage-EMAs liegt, die direkt vom Anstieg des Verkäufers beeinflusst werden und weiter nach unten fallen könnten, um darunter zu liegen Ebene.
The SHIB crypto asset is exhibiting bearish weakness as the MACD indicator is showing a bearish cross and is below the zero line. Whereas the MACD line is at -0.00000018 and the signal line is at -0.00000011, both lines have increasing width in the downward direction, a.k.a histogram value is at -0.00000007.
Das SHIB-Krypto-Asset zeigt eine rückläufige Schwäche, da der MACD-Indikator ein rückläufiges Kreuz zeigt und unter der Nulllinie liegt. Während die MACD-Linie bei -0,00000018 und die Signallinie bei -0,00000011 liegt, weisen beide Linien nach unten hin eine zunehmende Breite auf, ein Histogrammwert liegt bei -0,00000007.
The RSI is below 50, implying that the asset is still in negative territory and can sink further down. It is also seen that RSI has been facing rejection from the 14-SMA and the curve is declining. Meanwhile, the RSI is at 42.64, and 14- SMA is at 45.79.
Der RSI liegt unter 50, was bedeutet, dass sich der Vermögenswert immer noch im negativen Bereich befindet und weiter sinken kann. Es ist auch zu erkennen, dass der RSI auf Ablehnung durch den 14-SMA stößt und die Kurve abnimmt. Mittlerweile liegt der RSI bei 42,64 und der 14-SMA bei 45,79.
An overall analysis of the major indicators and trend-based tools portray bearish outlooks and elaborates the potential for more downward moves in the near future.
Eine Gesamtanalyse der wichtigsten Indikatoren und trendbasierten Tools zeigt pessimistische Aussichten und erläutert das Potenzial für weitere Abwärtsbewegungen in naher Zukunft.
As per the price movements, the price structure was bullish earlier before the start of the year 2024. However, that uptrend was violated as the price faced an enormous struggle around the supply region around at $0.00001150 level on the chart, and prices started making lower lows and highs along the way.
Den Preisbewegungen zufolge war die Preisstruktur vor Beginn des Jahres 2024 bullisch. Dieser Aufwärtstrend wurde jedoch unterbrochen, da der Preis im Angebotsbereich um das Niveau von 0,00001150 USD auf dem Chart einem enormen Kampf ausgesetzt war und die Preise zu sinken begannen Tiefs und Höhen auf dem Weg.
At the time of publishing the SHIB crypto price is at $0.00000926 and shows a 24-hour last intraday surge of 0.65%.
Zum Zeitpunkt der Veröffentlichung liegt der SHIB-Kryptopreis bei 0,00000926 US-Dollar und weist innerhalb von 24 Stunden einen letzten Intraday-Anstieg von 0,65 % auf.
Therefore, if the SHIB price slips downward, it could slide towards lower levels and even reach the demand zone.
Wenn der SHIB-Preis daher nach unten rutscht, könnte er in Richtung niedrigerer Niveaus abrutschen und sogar die Nachfragezone erreichen.
Alternatively, if the price manages to survive and hold the current level. The SHIB could rise extravagantly and could go up for testing out the supply region again and could pierce through as well.
Alternativ, wenn es dem Preis gelingt, zu überleben und das aktuelle Niveau zu halten. Der SHIB könnte exzessiv ansteigen und die Versorgungsregion erneut testen und auch durchdringen.

Summary
Zusammenfassung
An overall analysis of the major indicators and trend-based tools portray bearish outlooks and elaborates the potential for more downward moves in the near future sessions. The price action also elaborates bearishness on the daily chart.
Therefore, if the SHIB price slips downward, it could slide toward $0.00001050 and lower levels and even reach the demand zone as well.
Eine Gesamtanalyse der wichtigsten Indikatoren und trendbasierten Tools zeigt pessimistische Aussichten und erläutert das Potenzial für weitere Abwärtsbewegungen in den nahen Zukunftssitzungen. Die Preisbewegung verdeutlicht auch den Abwärtstrend auf dem Tages-Chart. Wenn der SHIB-Preis daher nach unten rutscht, könnte er in Richtung 0,00001050 $ und niedrigere Niveaus abrutschen und sogar die Nachfragezone erreichen.
Technical Levels
Technische Ebenen
Support Levels: $0.00000850
Unterstützungsstufen: 0,00000850 $
Resistance Levels: $0.00001050
Widerstandsniveaus: 0,00001050 $
Disclaimer
Haftungsausschluss
In this article, the views, and opinions stated by the author, or any people named are for informational purposes only, and they don’t establish the investment, financial, or any other advice. Trading or investing in cryptocurrency assets comes with a risk of financial loss.
Die in diesem Artikel geäußerten Ansichten und Meinungen des Autors oder der genannten Personen dienen nur zu Informationszwecken und stellen keine Anlage-, Finanz- oder sonstige Beratung dar. Der Handel oder die Investition in Kryptowährungsanlagen birgt das Risiko eines finanziellen Verlusts.


 Optimisus
 Cryptopolitan_News
 DogeHome
 Cryptopolitan
 crypto.ro English
 Crypto News Land
 ETHNews


