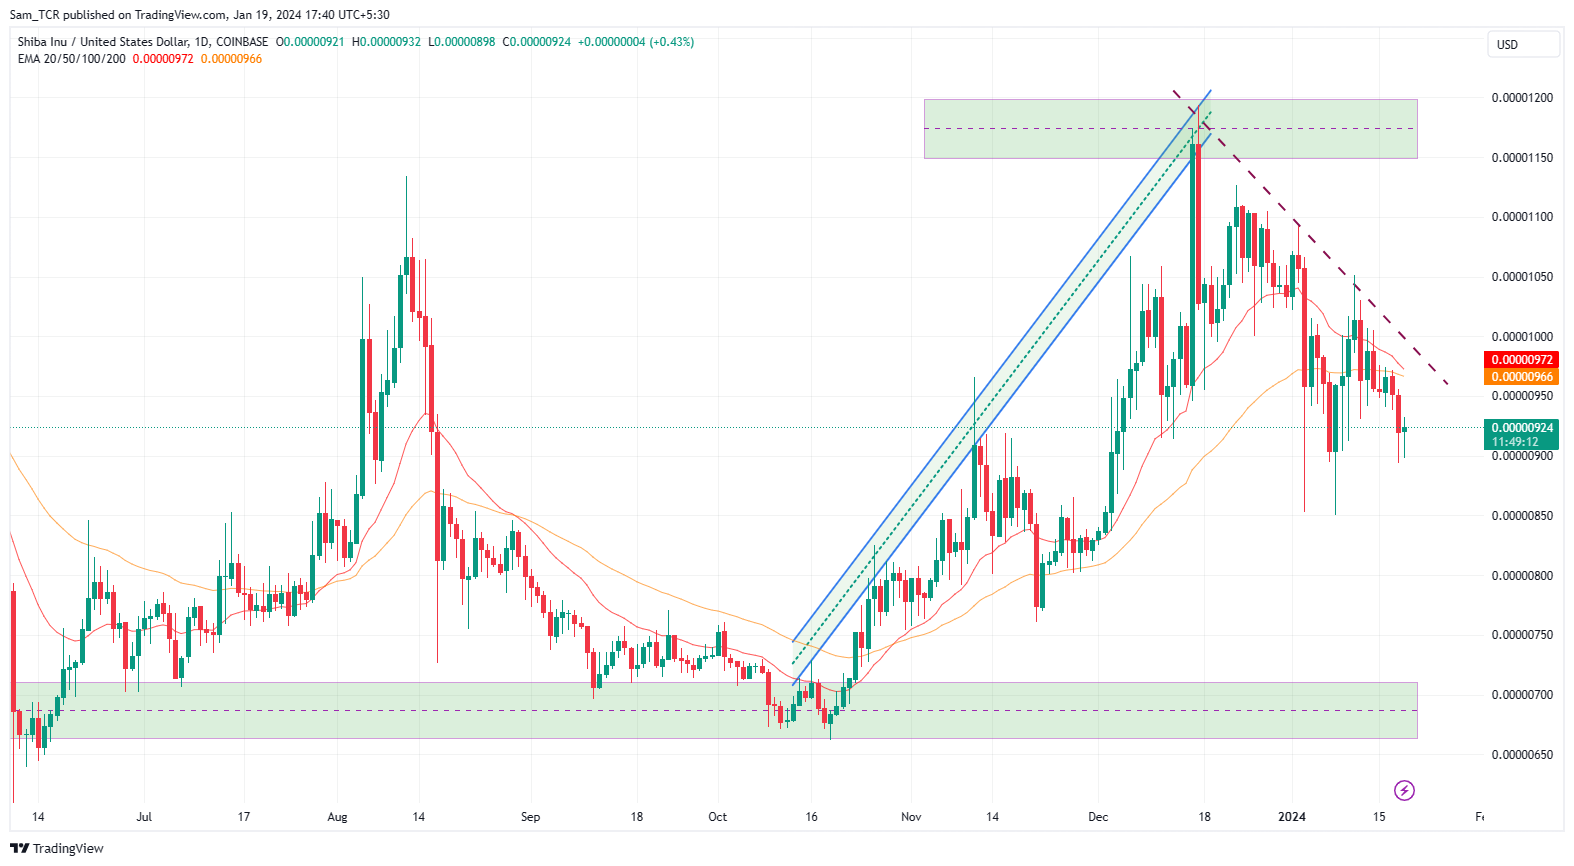
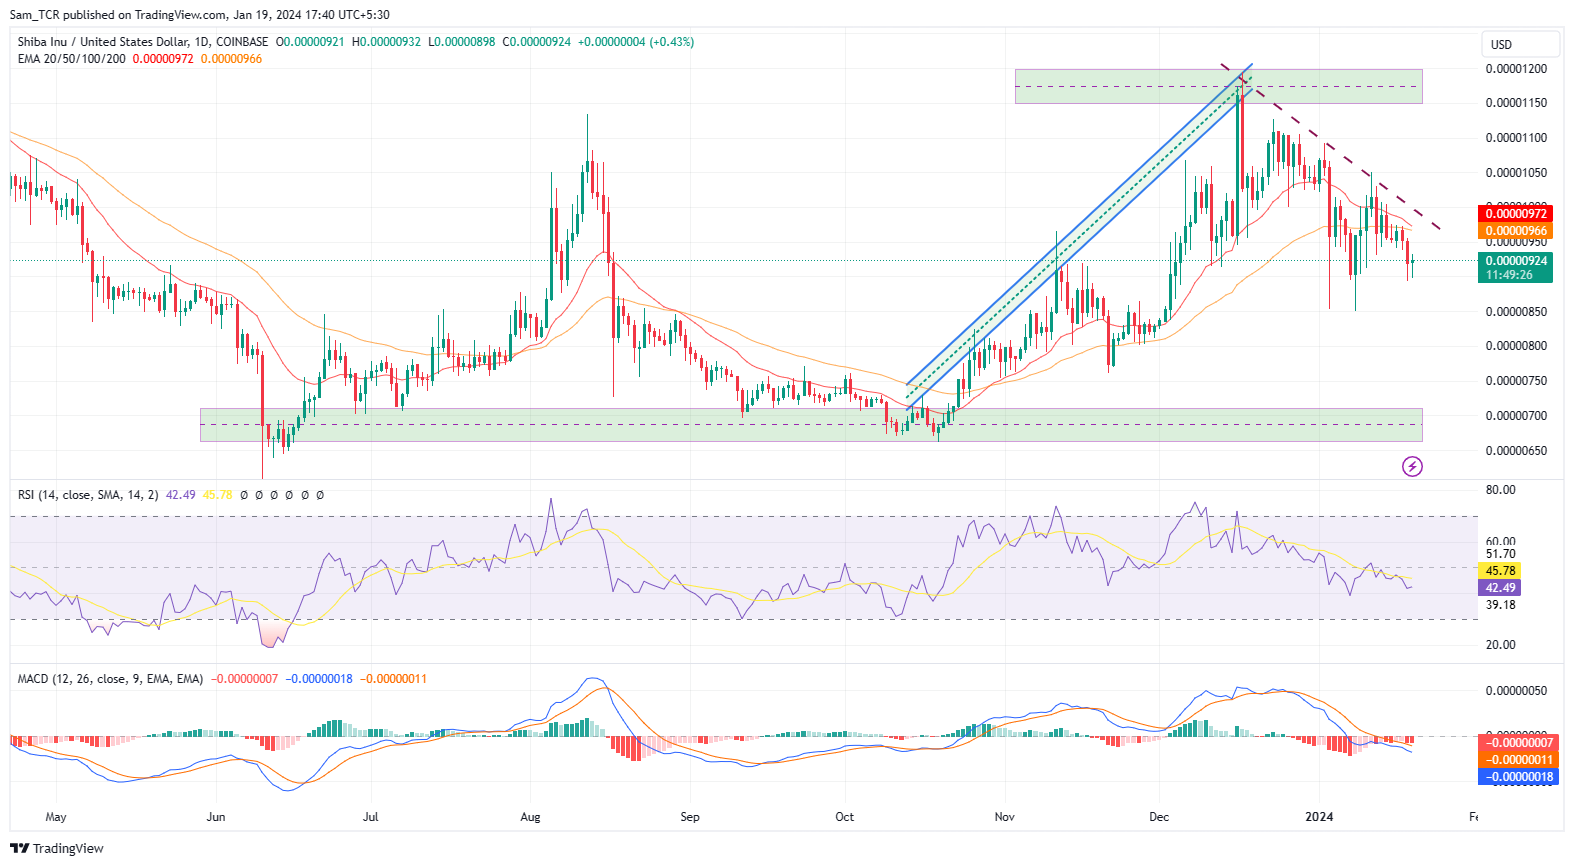
- 1 The SHIB crypto asset is showing bearishness and declined sharply from the supply region.
- 2 The analysis of the major indicators and trend-based tools confirm a bearish outlook.
1 SHIB 암호화폐 자산은 약세를 보이고 있으며 공급 지역에서 급격한 하락세를 보이고 있습니다.
2 주요 지표 분석과 추세 기반 도구를 통해 약세 전망이 확인되었습니다.
SHIB is a crypto that was born from memes and aims to be a project run by the community. It is based on Ethereum and is directly a rival to Dogecoin (DOGE). Its symbol is made out of a Shiba Inu, and that is a type of dog from Japan.
SHIB는 밈에서 탄생한 암호화폐로 커뮤니티가 운영하는 프로젝트를 지향합니다. Ethereum을 기반으로 하며 Dogecoin(DOGE)과 직접적으로 경쟁합니다. 그 상징은 시바견으로 만들어졌는데, 그것은 일본에서 온 개 종류입니다.
Shiba Inu was developed in August 2020 by an anonymous and unknown person called Ryoshi. Ryoshi then gave the meme crypto to its community, which has kept developing the Shiba Inu ecosystem.
시바견은 2020년 8월 료시(Ryoshi)라는 익명의 알려지지 않은 사람에 의해 개발되었습니다. 그런 다음 Ryoshi는 Shiba Inu 생태계를 계속 발전시켜온 커뮤니티에 밈 암호화폐를 제공했습니다.
Ryoshi said that SHIB was an “experiment in decentralized spontaneous community building”, and since then, the crypto has reached over one million holders on the Ethereum network. Ryoshi further says that the Shiba Inu crypto’s ecosystem was created on Ethereum because it was a safe option.
Ryoshi는 SHIB가 "분산형 자발적인 커뮤니티 구축에 대한 실험"이라고 말했으며, 그 이후로 이 암호화폐는 이더리움 네트워크에서 백만 명 이상의 보유자에게 도달했습니다. Ryoshi는 또한 Shiba Inu 암호화폐 생태계가 안전한 옵션이기 때문에 Ethereum에서 생성되었다고 말합니다.
Can SHIBA INU Fall Like a Sharp Knife Soon
SHIBA INU가 곧 날카로운 칼처럼 떨어질 수 있습니까?

The SHIB crypto asset is showing bearishness and falling potential as it declines from the supply region at $0.00001150 which is below the major trend 20, and 50-Day EMAs, which is influenced directly by the seller’s surge, and could slump more downward to reach below level.
SHIB 암호화폐 자산은 판매자 급증의 직접적인 영향을 받는 주요 추세인 20, 50일 EMA 아래인 $0.00001150에서 공급 영역에서 하락하면서 약세 및 하락 가능성을 보이고 있으며, 더 하락하여 아래에 도달할 수 있습니다. 수준.
The SHIB crypto asset is exhibiting bearish weakness as the MACD indicator is showing a bearish cross and is below the zero line. Whereas the MACD line is at -0.00000018 and the signal line is at -0.00000011, both lines have increasing width in the downward direction, a.k.a histogram value is at -0.00000007.
MACD 지표가 약세 교차를 보이고 0선 아래에 있기 때문에 SHIB 암호화폐 자산은 약세 약점을 보이고 있습니다. MACD 라인은 -0.00000018에 있고 신호 라인은 -0.00000011에 있는 반면, 두 라인 모두 아래쪽 방향으로 폭이 증가하며, 즉 히스토그램 값은 -0.00000007에 있습니다.
The RSI is below 50, implying that the asset is still in negative territory and can sink further down. It is also seen that RSI has been facing rejection from the 14-SMA and the curve is declining. Meanwhile, the RSI is at 42.64, and 14- SMA is at 45.79.
RSI는 50 미만으로 자산이 여전히 마이너스 영역에 있으며 더 하락할 수 있음을 의미합니다. 또한 RSI가 14-SMA에서 거부되어 곡선이 감소하는 것으로 나타났습니다. 한편 RSI는 42.64, 14-SMA는 45.79입니다.
An overall analysis of the major indicators and trend-based tools portray bearish outlooks and elaborates the potential for more downward moves in the near future.
주요 지표와 추세 기반 도구에 대한 전반적인 분석은 약세 전망을 묘사하고 가까운 미래에 더 하락할 가능성을 자세히 설명합니다.
As per the price movements, the price structure was bullish earlier before the start of the year 2024. However, that uptrend was violated as the price faced an enormous struggle around the supply region around at $0.00001150 level on the chart, and prices started making lower lows and highs along the way.
가격 움직임에 따라 가격 구조는 2024년이 시작되기 전에는 강세를 보였습니다. 그러나 가격이 차트의 $0.00001150 수준에서 공급 영역을 중심으로 엄청난 투쟁에 직면하면서 가격이 하락하기 시작하면서 이러한 상승 추세가 깨졌습니다. 길을 따라 최저점과 최고점.
At the time of publishing the SHIB crypto price is at $0.00000926 and shows a 24-hour last intraday surge of 0.65%.
게시 당시 SHIB 암호화폐 가격은 $0.00000926이며 24시간 동안 마지막 장중 0.65% 급등을 보여줍니다.
Therefore, if the SHIB price slips downward, it could slide towards lower levels and even reach the demand zone.
따라서 SHIB 가격이 하락할 경우 더 낮은 수준으로 하락할 수 있으며 심지어 수요 영역에도 도달할 수 있습니다.
Alternatively, if the price manages to survive and hold the current level. The SHIB could rise extravagantly and could go up for testing out the supply region again and could pierce through as well.
또는 가격이 현재 수준을 유지하고 유지하는 경우. SHIB는 엄청나게 상승할 수 있고 공급 지역을 다시 테스트하기 위해 올라갈 수도 있고 관통할 수도 있습니다.

Summary
요약
An overall analysis of the major indicators and trend-based tools portray bearish outlooks and elaborates the potential for more downward moves in the near future sessions. The price action also elaborates bearishness on the daily chart.
Therefore, if the SHIB price slips downward, it could slide toward $0.00001050 and lower levels and even reach the demand zone as well.
주요 지표와 추세 기반 도구에 대한 전반적인 분석은 약세 전망을 묘사하고 가까운 미래 세션에서 더 하락할 가능성을 자세히 설명합니다. 가격 움직임은 또한 일일 차트의 약세를 자세히 설명합니다. 따라서 SHIB 가격이 하락하면 $0.00001050 이하 수준으로 하락할 수 있으며 수요 영역에도 도달할 수도 있습니다.
Technical Levels
기술 수준
Support Levels: $0.00000850
지원 수준: $0.00000850
Resistance Levels: $0.00001050
저항 수준: $0.00001050
Disclaimer
부인 성명
In this article, the views, and opinions stated by the author, or any people named are for informational purposes only, and they don’t establish the investment, financial, or any other advice. Trading or investing in cryptocurrency assets comes with a risk of financial loss.
이 기사에서 저자 또는 언급된 사람들이 언급한 견해와 의견은 정보 제공 목적으로만 제공되며 투자, 재정 또는 기타 조언을 확립하지 않습니다. 암호화폐 자산을 거래하거나 투자하면 재정적 손실이 발생할 위험이 있습니다.


 Optimisus
 Crypto News Land
 Optimisus
 Cryptopolitan_News
 DogeHome
 Cryptopolitan
 crypto.ro English


