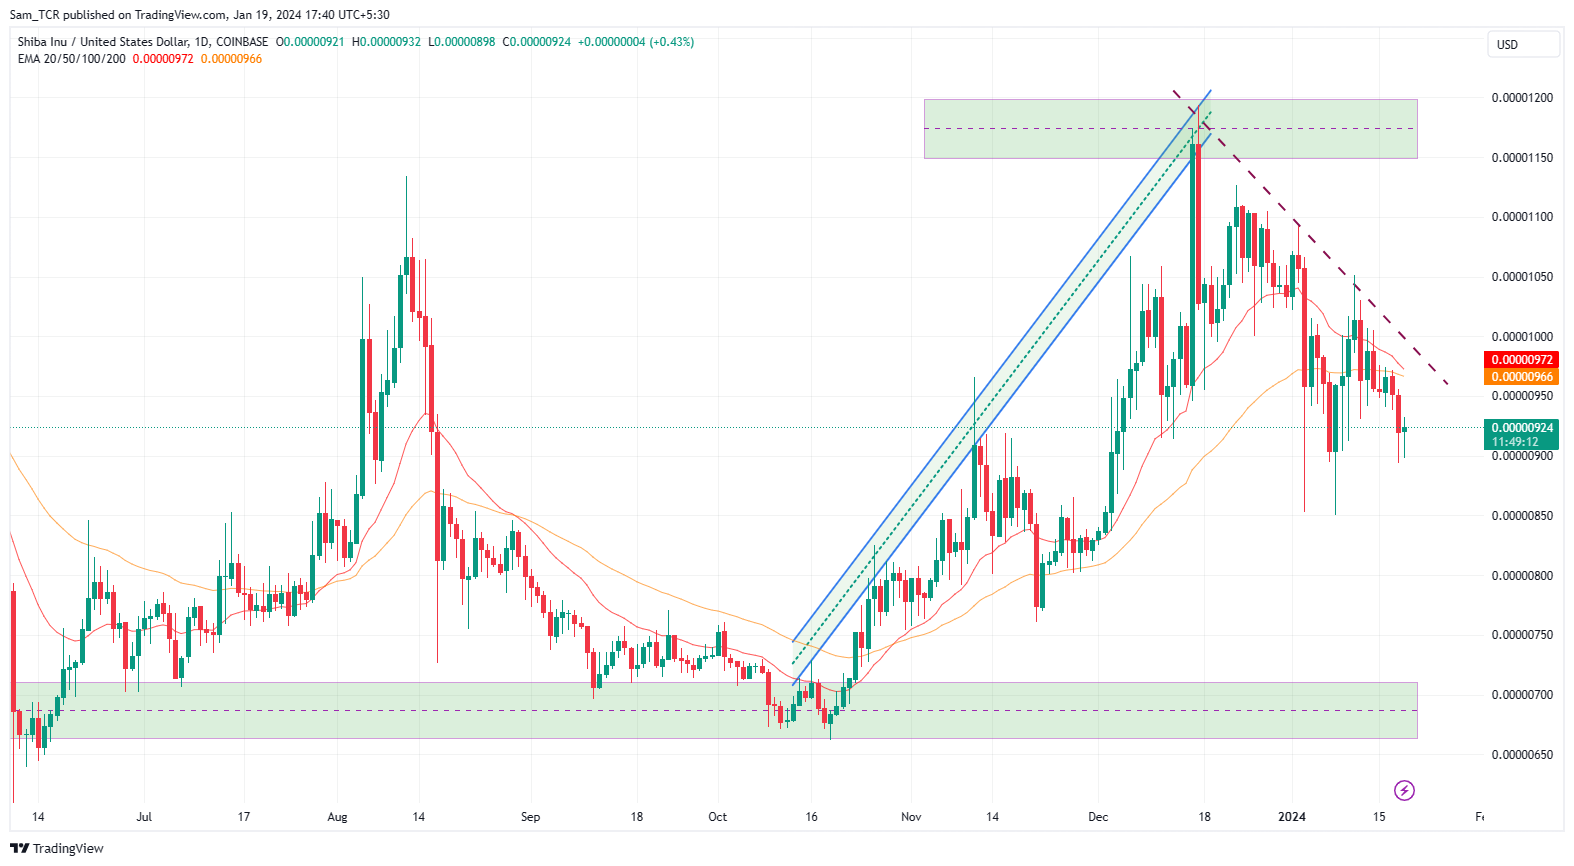
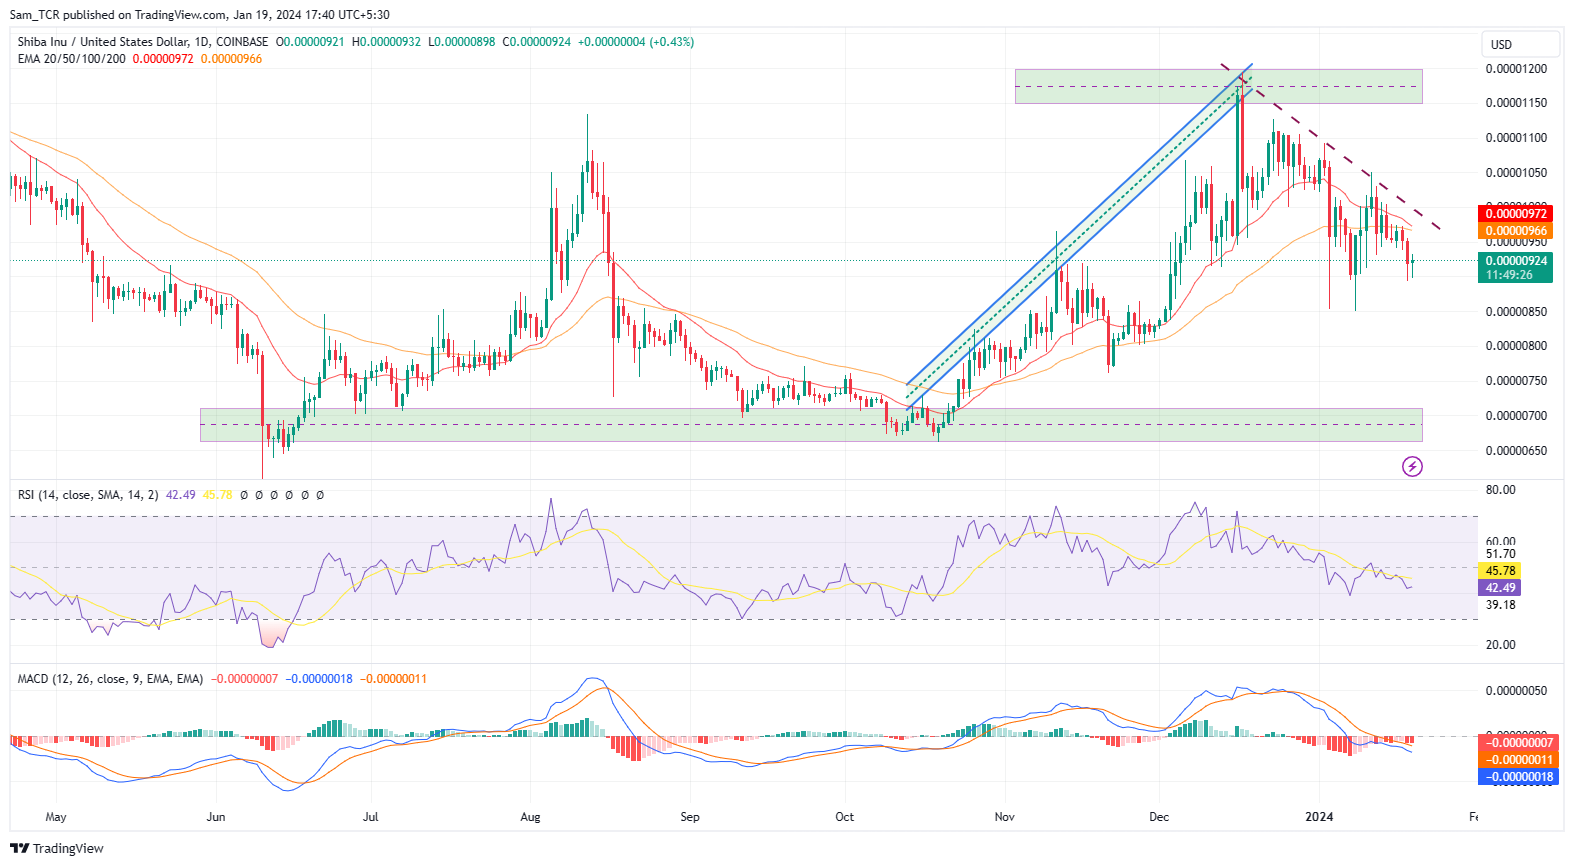
- 1 The SHIB crypto asset is showing bearishness and declined sharply from the supply region.
- 2 The analysis of the major indicators and trend-based tools confirm a bearish outlook.
1 SHIB加密资产呈现看跌态势,从供应区域大幅下跌。
2 主要指标和趋势工具的分析证实了看跌前景。
SHIB is a crypto that was born from memes and aims to be a project run by the community. It is based on Ethereum and is directly a rival to Dogecoin (DOGE). Its symbol is made out of a Shiba Inu, and that is a type of dog from Japan.
SHIB是一种从模因中诞生的加密货币,旨在成为一个由社区运营的项目。它基于以太坊,是狗狗币(DOGE)的直接竞争对手。它的标志是由柴犬制成的,这是一种来自日本的狗。
Shiba Inu was developed in August 2020 by an anonymous and unknown person called Ryoshi. Ryoshi then gave the meme crypto to its community, which has kept developing the Shiba Inu ecosystem.
Shiba Inu 于 2020 年 8 月由一位名叫 Ryoshi 的匿名人士开发。 Ryoshi 随后将模因加密货币提供给其社区,该社区一直在发展柴犬生态系统。
Ryoshi said that SHIB was an “experiment in decentralized spontaneous community building”, and since then, the crypto has reached over one million holders on the Ethereum network. Ryoshi further says that the Shiba Inu crypto’s ecosystem was created on Ethereum because it was a safe option.
Ryoshi 表示,SHIB 是“去中心化自发社区建设的实验”,从那时起,该加密货币已在以太坊网络上覆盖了超过 100 万持有者。 Ryoshi 进一步表示,柴犬加密货币生态系统是在以太坊上创建的,因为它是一个安全的选择。
Can SHIBA INU Fall Like a Sharp Knife Soon
柴犬很快就会像尖刀一样倒下吗

The SHIB crypto asset is showing bearishness and falling potential as it declines from the supply region at $0.00001150 which is below the major trend 20, and 50-Day EMAs, which is influenced directly by the seller’s surge, and could slump more downward to reach below level.
SHIB 加密资产显示出看跌和下跌潜力,因为它从 0.00001150 美元的供应区域下跌,该区域低于主要趋势 20 和 50 天 EMA,直接受到卖方飙升的影响,并可能进一步下跌至下方等级。
The SHIB crypto asset is exhibiting bearish weakness as the MACD indicator is showing a bearish cross and is below the zero line. Whereas the MACD line is at -0.00000018 and the signal line is at -0.00000011, both lines have increasing width in the downward direction, a.k.a histogram value is at -0.00000007.
由于 MACD 指标显示看跌交叉且位于零线下方,SHIB 加密资产表现出看跌疲软。尽管 MACD 线位于 -0.00000018,信号线位于 -0.00000011,但两条线的宽度都在向下方向上增加,即直方图值位于 -0.00000007。
The RSI is below 50, implying that the asset is still in negative territory and can sink further down. It is also seen that RSI has been facing rejection from the 14-SMA and the curve is declining. Meanwhile, the RSI is at 42.64, and 14- SMA is at 45.79.
RSI 低于 50,意味着该资产仍处于负值区域,并可能进一步下跌。还可以看出,RSI 已面临 14-SMA 的拒绝,并且曲线正在下降。与此同时,RSI 为 42.64,14-SMA 为 45.79。
An overall analysis of the major indicators and trend-based tools portray bearish outlooks and elaborates the potential for more downward moves in the near future.
对主要指标和基于趋势的工具的总体分析描绘了看跌前景,并阐述了在不久的将来进一步下跌的可能性。
As per the price movements, the price structure was bullish earlier before the start of the year 2024. However, that uptrend was violated as the price faced an enormous struggle around the supply region around at $0.00001150 level on the chart, and prices started making lower lows and highs along the way.
根据价格走势,价格结构在 2024 年初之前是看涨的。然而,由于价格在图表上的 0.00001150 美元水平附近的供应区域面临巨大的挣扎,因此这一上升趋势被打破了,并且价格开始走低一路上的低点和高点。
At the time of publishing the SHIB crypto price is at $0.00000926 and shows a 24-hour last intraday surge of 0.65%.
截至发布时,SHIB 加密货币价格为 0.00000926 美元,24 小时最后盘中上涨 0.65%。
Therefore, if the SHIB price slips downward, it could slide towards lower levels and even reach the demand zone.
因此,如果SHIB价格下滑,它可能会滑向较低水平,甚至到达需求区域。
Alternatively, if the price manages to survive and hold the current level. The SHIB could rise extravagantly and could go up for testing out the supply region again and could pierce through as well.
或者,如果价格能够维持并保持当前水平。 SHIB可能会大幅上涨,可能会再次测试供应区域,也可能会突破。

Summary
概括
An overall analysis of the major indicators and trend-based tools portray bearish outlooks and elaborates the potential for more downward moves in the near future sessions. The price action also elaborates bearishness on the daily chart.
Therefore, if the SHIB price slips downward, it could slide toward $0.00001050 and lower levels and even reach the demand zone as well.
对主要指标和基于趋势的工具的总体分析描绘了看跌前景,并阐述了在不久的将来交易中进一步下跌的可能性。价格走势也在日线图上阐述了看跌情绪。因此,如果 SHIB 价格下滑,它可能会滑向 0.00001050 美元及更低的水平,甚至也达到需求区域。
Technical Levels
技术水平
Support Levels: $0.00000850
支持水平: $0.00000850
Resistance Levels: $0.00001050
阻力位:$0.00001050
Disclaimer
免责声明
In this article, the views, and opinions stated by the author, or any people named are for informational purposes only, and they don’t establish the investment, financial, or any other advice. Trading or investing in cryptocurrency assets comes with a risk of financial loss.
在本文中,作者或任何指定人士陈述的观点和意见仅供参考,并不构成投资、财务或任何其他建议。交易或投资加密货币资产会带来财务损失的风险。


 Optimisus
 Crypto News Land
 Optimisus
 Cryptopolitan_News
 DogeHome
 Cryptopolitan
 crypto.ro English


