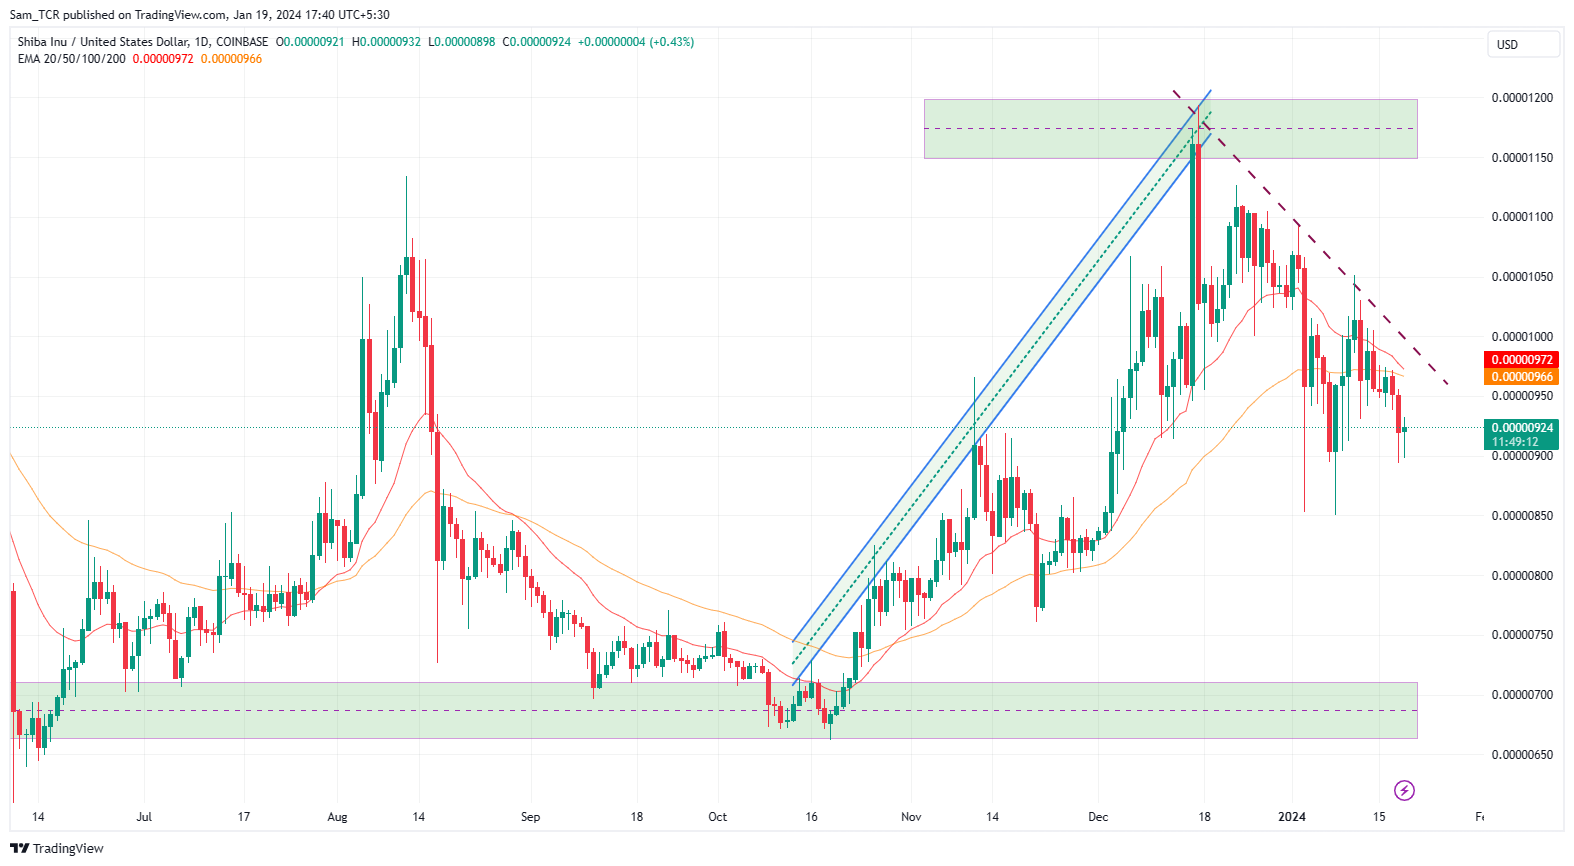
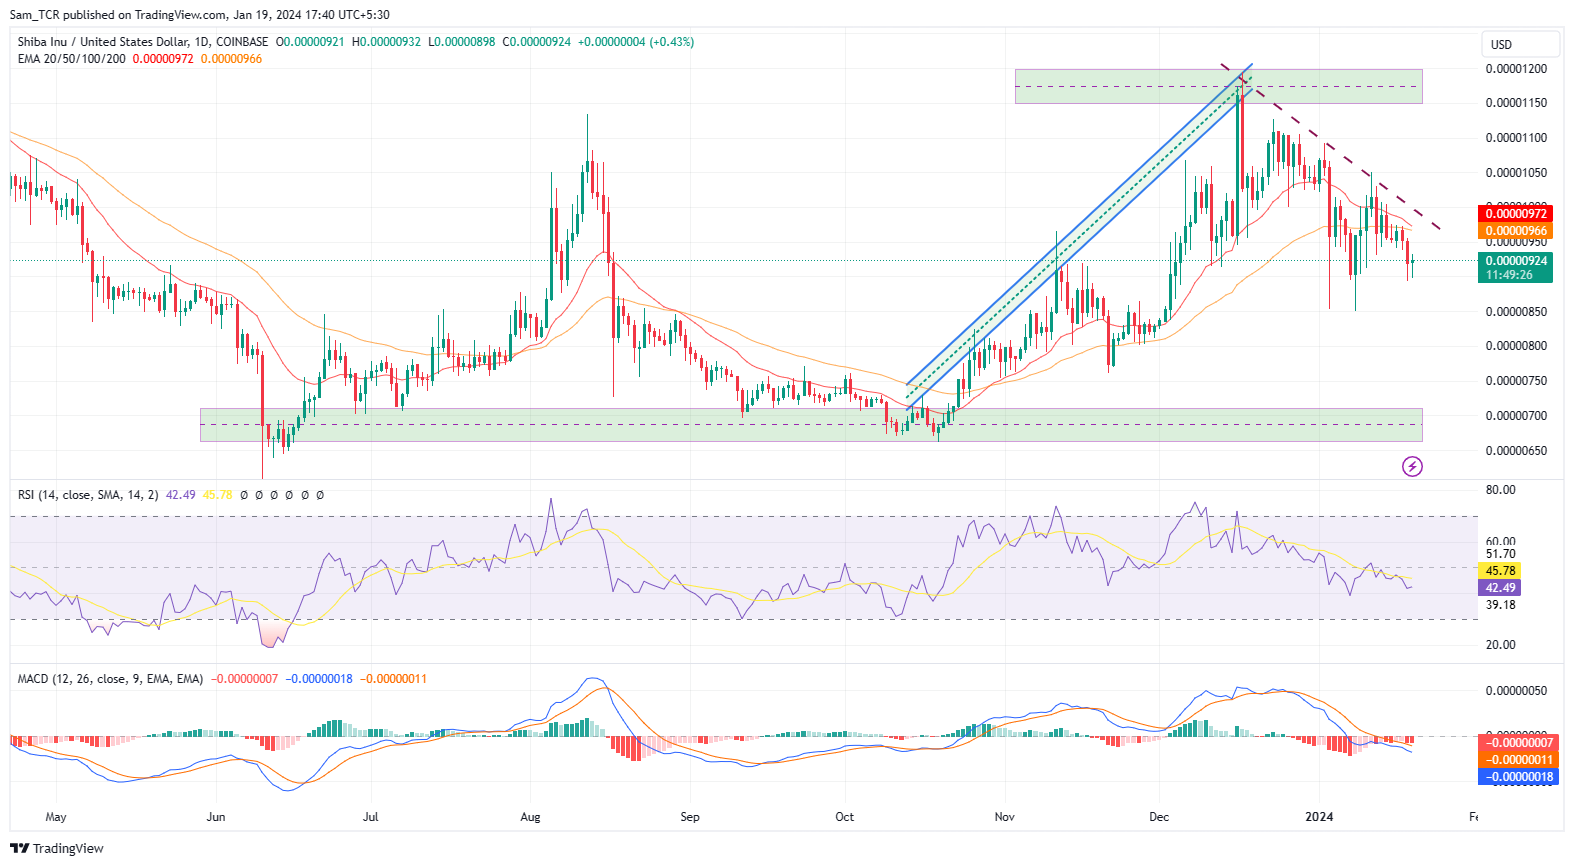
- 1 The SHIB crypto asset is showing bearishness and declined sharply from the supply region.
- 2 The analysis of the major indicators and trend-based tools confirm a bearish outlook.
1 SHIB暗号資産は弱気を示し、供給領域から大幅に下落しました。
2 主要な指標とトレンドベースのツールの分析により、弱気の見通しが確認されています。
SHIB is a crypto that was born from memes and aims to be a project run by the community. It is based on Ethereum and is directly a rival to Dogecoin (DOGE). Its symbol is made out of a Shiba Inu, and that is a type of dog from Japan.
SHIB はミームから生まれた暗号通貨であり、コミュニティによって運営されるプロジェクトを目指しています。これはイーサリアムに基づいており、ドージコイン (DOGE) の直接のライバルです。そのシンボルは日本原産の犬である柴犬で作られています。
Shiba Inu was developed in August 2020 by an anonymous and unknown person called Ryoshi. Ryoshi then gave the meme crypto to its community, which has kept developing the Shiba Inu ecosystem.
柴犬は2020年8月にRyoshiという匿名・正体不明の人物によって開発されました。その後、Ryoshi はそのミーム暗号をコミュニティに提供し、コミュニティは柴犬のエコシステムを発展させ続けてきました。
Ryoshi said that SHIB was an “experiment in decentralized spontaneous community building”, and since then, the crypto has reached over one million holders on the Ethereum network. Ryoshi further says that the Shiba Inu crypto’s ecosystem was created on Ethereum because it was a safe option.
リョウシ氏は、SHIBは「分散型自発的コミュニティ構築の実験」であり、それ以来、この暗号通貨はイーサリアムネットワーク上で100万人以上の保有者に到達したと述べた。さらに、Ryoshi 氏は、柴犬暗号通貨のエコシステムはイーサリアム上に作成されたのは、それが安全な選択肢だったからであると述べています。
Can SHIBA INU Fall Like a Sharp Knife Soon
柴犬はすぐに鋭いナイフのように倒れますか

The SHIB crypto asset is showing bearishness and falling potential as it declines from the supply region at $0.00001150 which is below the major trend 20, and 50-Day EMAs, which is influenced directly by the seller’s surge, and could slump more downward to reach below level.
SHIB暗号資産は、主要トレンド20および50日EMAを下回る0.00001150ドルで供給領域から下落するにつれて、弱気さと下落の可能性を示しており、売り手の急騰に直接影響されるため、さらに下降して以下に達する可能性があります。レベル。
The SHIB crypto asset is exhibiting bearish weakness as the MACD indicator is showing a bearish cross and is below the zero line. Whereas the MACD line is at -0.00000018 and the signal line is at -0.00000011, both lines have increasing width in the downward direction, a.k.a histogram value is at -0.00000007.
MACD指標が弱気のクロスを示し、ゼロラインを下回っているため、SHIB暗号資産は弱気の弱さを示しています。 MACD ラインは -0.00000018、シグナル ラインは -0.00000011 ですが、どちらのラインも下方向に幅が増加しており、別名ヒストグラム値は -0.00000007 です。
The RSI is below 50, implying that the asset is still in negative territory and can sink further down. It is also seen that RSI has been facing rejection from the 14-SMA and the curve is declining. Meanwhile, the RSI is at 42.64, and 14- SMA is at 45.79.
RSIは50を下回っており、資産が依然としてマイナス領域にあり、さらに下落する可能性があることを示唆しています。また、RSI が 14-SMA からの拒否に直面しており、曲線が低下していることもわかります。一方、RSIは42.64、14-SMAは45.79です。
An overall analysis of the major indicators and trend-based tools portray bearish outlooks and elaborates the potential for more downward moves in the near future.
主要な指標とトレンドベースのツールの全体的な分析により、弱気の見通しが描かれ、近い将来さらに下降する可能性が詳しく説明されます。
As per the price movements, the price structure was bullish earlier before the start of the year 2024. However, that uptrend was violated as the price faced an enormous struggle around the supply region around at $0.00001150 level on the chart, and prices started making lower lows and highs along the way.
価格変動によると、2024 年が始まる前の早い時期、価格構造は強気でした。しかし、価格がチャート上の 0.00001150 ドルレベル付近で供給領域の周囲で大きな苦戦に直面し、価格が下落し始めたため、その上昇傾向は破られました。途中で安値も高値も。
At the time of publishing the SHIB crypto price is at $0.00000926 and shows a 24-hour last intraday surge of 0.65%.
公開時点で、SHIB 暗号価格は 0.00000926 ドルで、24 時間の最後の日中上昇率は 0.65% でした。
Therefore, if the SHIB price slips downward, it could slide towards lower levels and even reach the demand zone.
したがって、SHIB価格が下落した場合、より低いレベルに向かって下落し、需要ゾーンに到達する可能性もあります。
Alternatively, if the price manages to survive and hold the current level. The SHIB could rise extravagantly and could go up for testing out the supply region again and could pierce through as well.
あるいは、価格がなんとか生き残り、現在のレベルを維持できる場合。 SHIBは大幅に上昇する可能性があり、供給地域を再度テストするために上昇する可能性があり、同様に貫通する可能性もあります。

Summary
まとめ
An overall analysis of the major indicators and trend-based tools portray bearish outlooks and elaborates the potential for more downward moves in the near future sessions. The price action also elaborates bearishness on the daily chart.
Therefore, if the SHIB price slips downward, it could slide toward $0.00001050 and lower levels and even reach the demand zone as well.
主要な指標とトレンドベースのツールの全体的な分析により、弱気の見通しが描かれ、近い将来の取引でさらに下降する可能性が詳しく説明されます。価格動向は日足チャートでも弱気を強調しています。したがって、SHIB価格が下落した場合、0.00001050ドル以下のレベルに向けて下落し、需要ゾーンに到達する可能性もあります。
Technical Levels
技術レベル
Support Levels: $0.00000850
サポートレベル: $0.00000850
Resistance Levels: $0.00001050
抵抗レベル: $0.00001050
Disclaimer
免責事項
In this article, the views, and opinions stated by the author, or any people named are for informational purposes only, and they don’t establish the investment, financial, or any other advice. Trading or investing in cryptocurrency assets comes with a risk of financial loss.
この記事では、著者または名前が挙げられた人物によって述べられた見解や意見は情報提供のみを目的としており、投資、財務、その他のアドバイスを確立するものではありません。暗号通貨資産の取引や投資には、経済的損失のリスクが伴います。


 Optimisus
 Crypto News Land
 Optimisus
 Cryptopolitan_News
 DogeHome
 Cryptopolitan
 crypto.ro English


