You can also read this news on COINTURK NEWS: Dogecoin Price Analysis Amidst Market Developments
También puede leer esta noticia en COINTURK NEWS: Análisis de precios de Dogecoin en medio de la evolución del mercado
With the latest developments in the cryptocurrency market, serious price corrections have occurred in the altcoin market. During this period, Bitcoin dominance continued to increase, and especially the growing optimism in spot Bitcoin ETF applications caused investors to turn to Bitcoin. So, what is happening with Dogecoin, the market’s largest memecoin project, during this process? Let’s take a look.
Con los últimos acontecimientos en el mercado de las criptomonedas, se han producido importantes correcciones de precios en el mercado de altcoins. Durante este período, el dominio de Bitcoin siguió aumentando y, especialmente, el creciente optimismo en las aplicaciones de ETF de Bitcoin al contado hizo que los inversores recurrieran a Bitcoin. Entonces, ¿qué está pasando con Dogecoin, el proyecto de memecoin más grande del mercado, durante este proceso? Vamos a ver.
Dogecoin Chart Analysis
Análisis de gráficos de Dogecoin
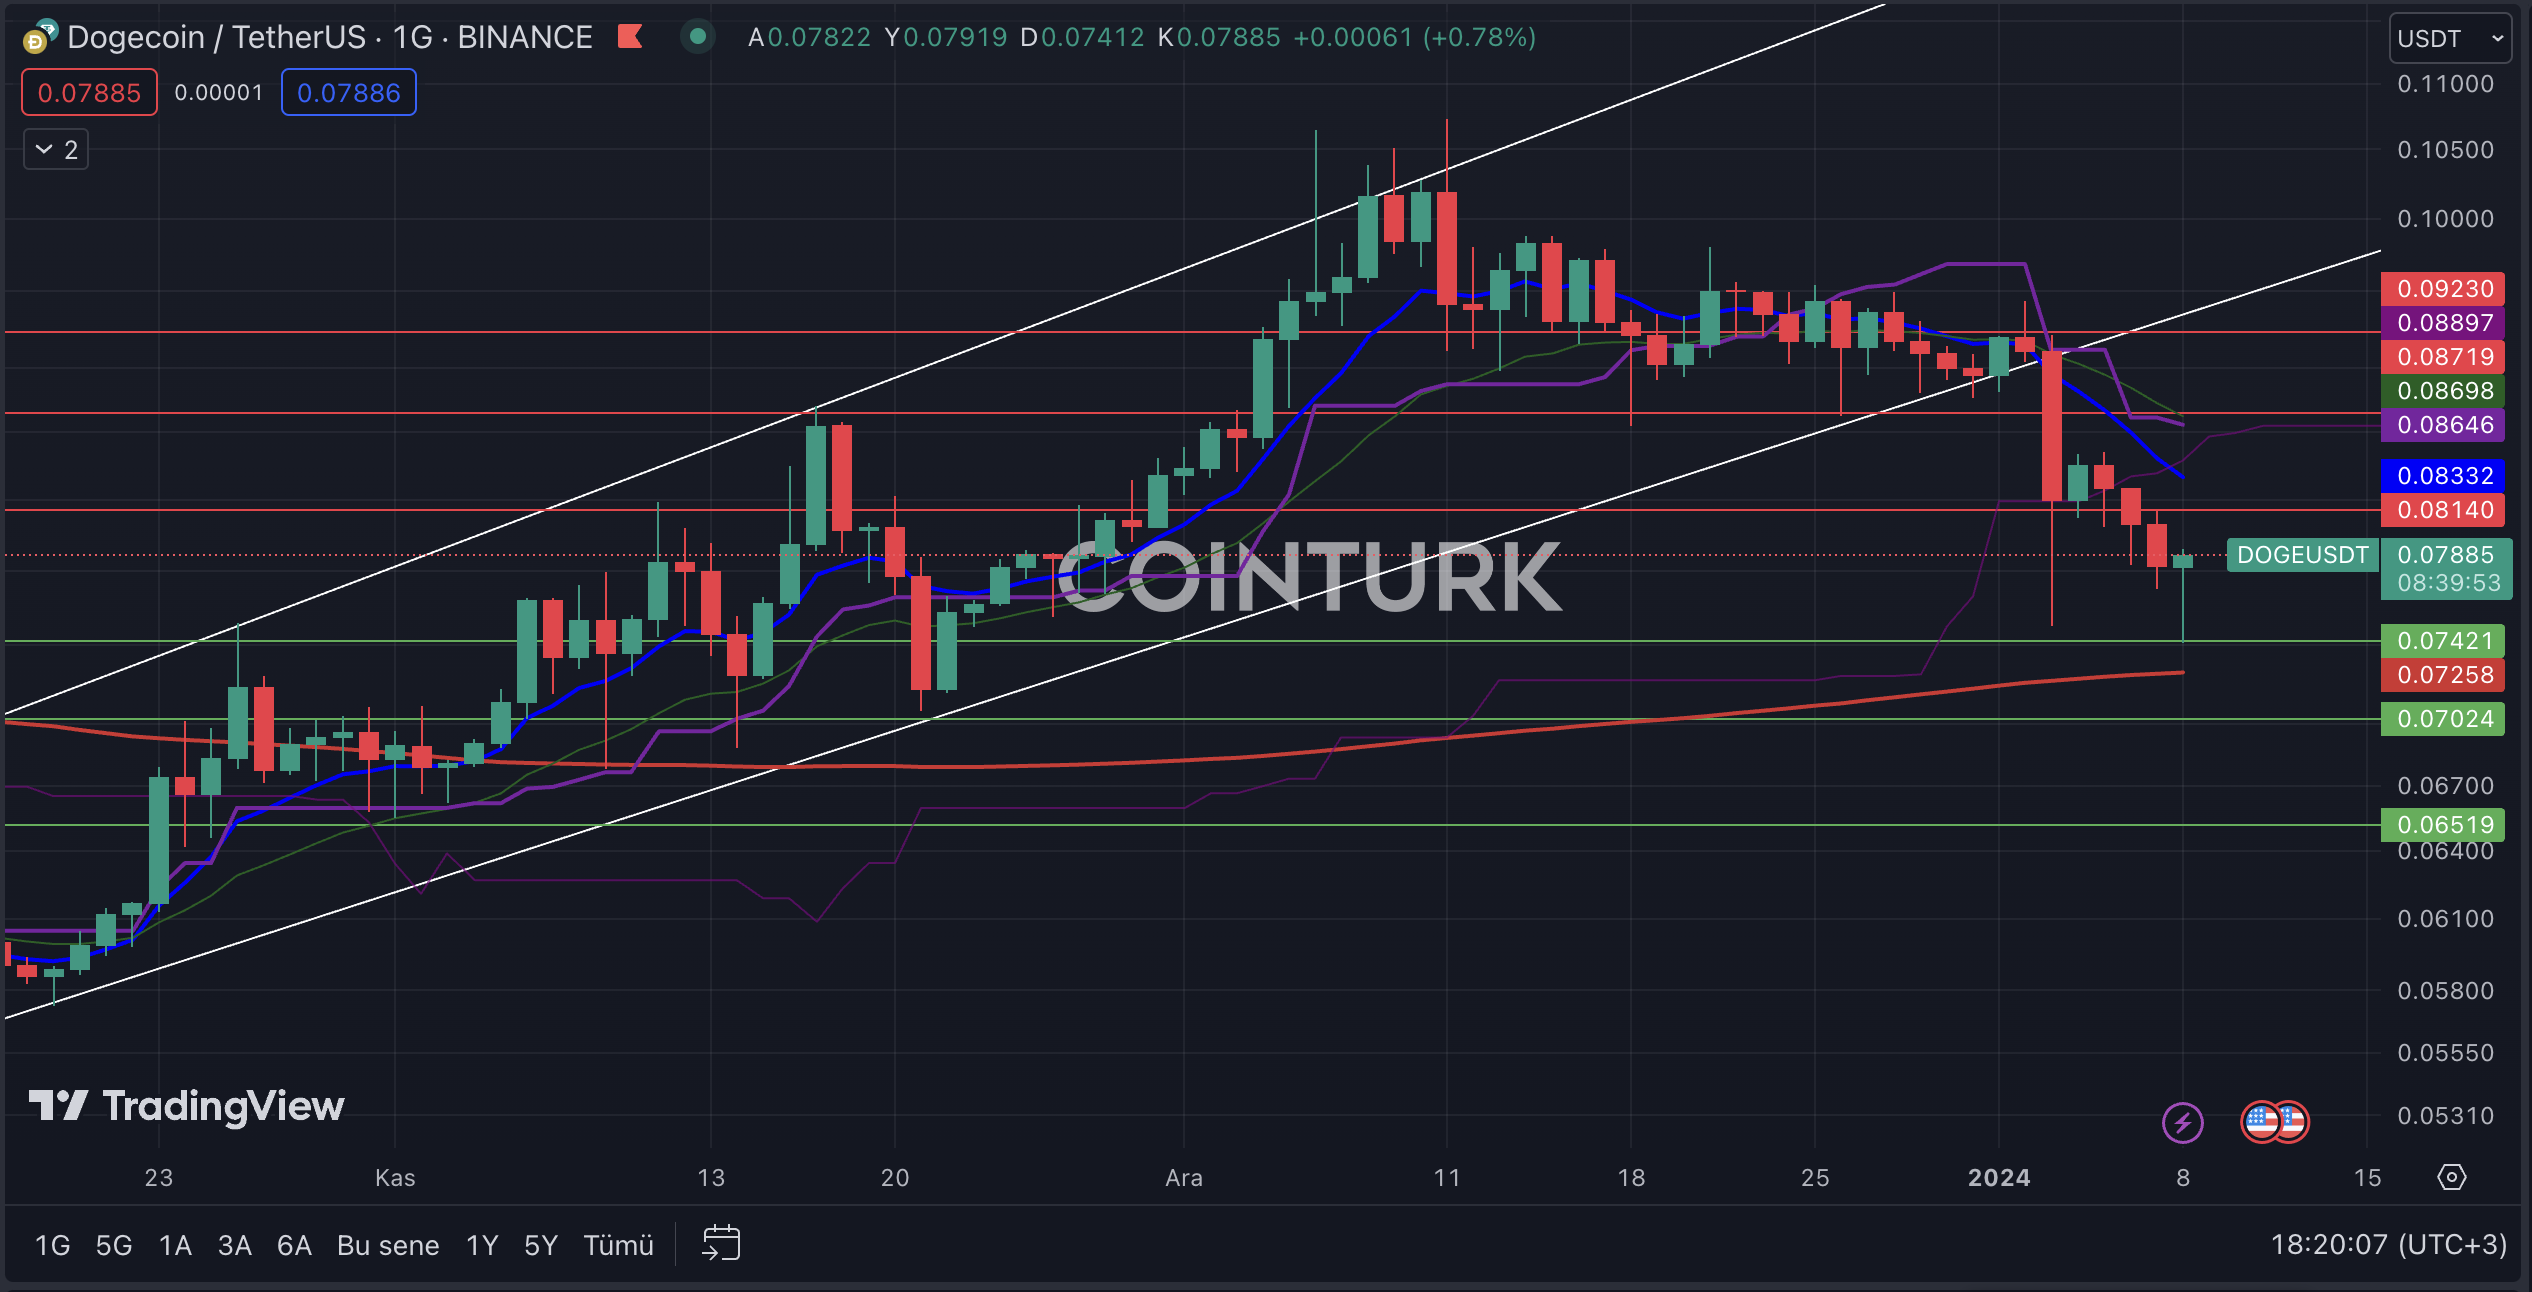
The daily DOGE chart was drawing attention with its ascending channel formation until the early days of 2024. However, the recent decline broke the support of the formation structure, and following this development, DOGE continues to face selling pressure. Support from the EMA 200 (red line) region, however, presents a positive scenario for the DOGE price.
El gráfico diario de DOGE llamó la atención con la formación de su canal ascendente hasta los primeros días de 2024. Sin embargo, la reciente caída rompió el soporte de la estructura de formación y, tras este desarrollo, DOGE continúa enfrentando presión de venta. Sin embargo, el soporte de la región EMA 200 (línea roja) presenta un escenario positivo para el precio de DOGE.
The most important support levels to watch on the DOGE chart are, in order; 0.07421 / 0.07024 and 0.06519 dollars. Particularly, a daily bar close below the 0.07421 dollar level, which played a major role in the last two declines, could lead to a drop in the DOGE price.
Los niveles de soporte más importantes a observar en el gráfico DOGE son, en orden; 0,07421 / 0,07024 y 0,06519 dólares. En particular, un cierre diario de la barra por debajo del nivel de 0,07421 dólares, que jugó un papel importante en las dos últimas caídas, podría provocar una caída en el precio de DOGE.
The most important resistance levels to watch on the daily DOGE chart are, in order; 0.08140 / 0.08719 and 0.09230 dollars. Especially, a daily bar close above the 0.08140 dollar level, which was a significant barrier in the last upward move, will increase the momentum of the DOGE price.
Los niveles de resistencia más importantes a observar en el gráfico diario de DOGE son, en orden; 0,08140 / 0,08719 y 0,09230 dólares. Especialmente, un cierre diario de la barra por encima del nivel de 0,08140 dólares, que fue una barrera importante en el último movimiento alcista, aumentará el impulso del precio de DOGE.

Dogecoin Weekly Chart Analysis
Análisis de gráficos semanales de Dogecoin
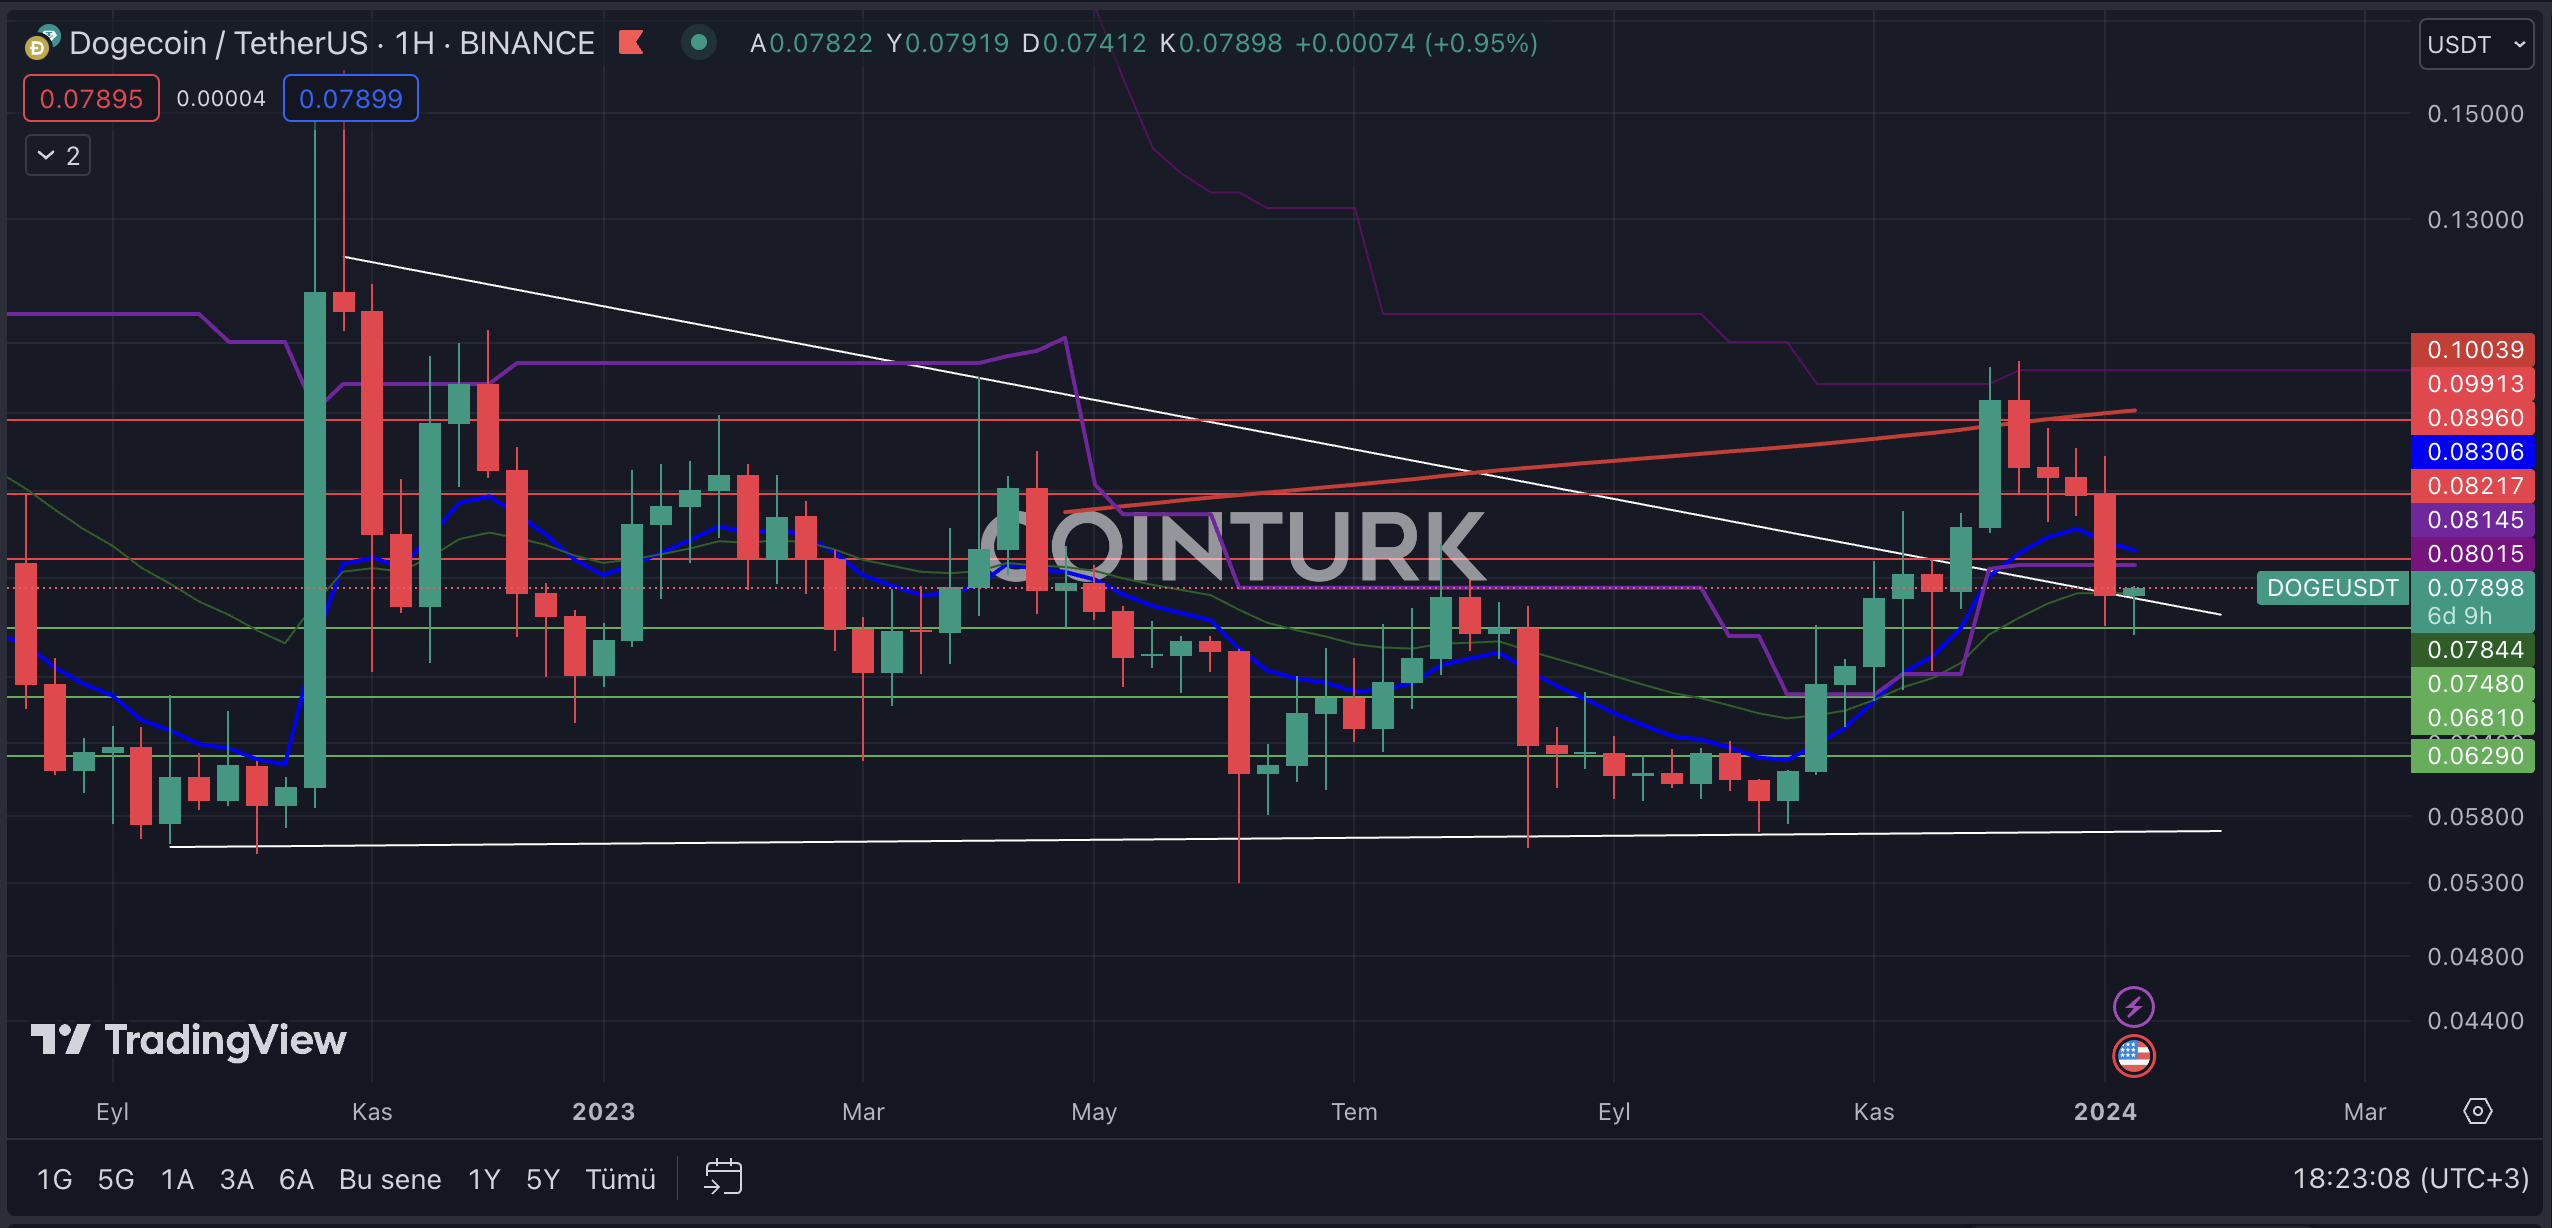
The first noticeable formation structure in the weekly Dogecoin chart is the contracting wedge formation. After breaking the resistance, DOGE, which encountered resistance at the EMA 200 level, could regain upward momentum if the formation resistance line acts as support. However, in the opposite case, a return to the formation area for DOGE could lead to contact with a potential support line and create significant selling pressure.
La primera estructura de formación notable en el gráfico semanal de Dogecoin es la formación de cuña de contracción. Después de romper la resistencia, DOGE, que encontró resistencia en el nivel EMA 200, podría recuperar impulso alcista si la línea de resistencia de la formación actúa como soporte. Sin embargo, en el caso contrario, un regreso al área de formación de DOGE podría llevar a un contacto con una posible línea de soporte y crear una presión de venta significativa.
The most important support levels to watch on the weekly DOGE chart are, in order; 0.07480 / 0.06810 and 0.06290 dollars. Particularly, a weekly bar close below the 0.07480 dollar level, which played an important role in the formation of the last two bars, could lead to significant selling pressure on the DOGE price.
Los niveles de soporte más importantes a observar en el gráfico semanal de DOGE son, en orden; 0,07480 / 0,06810 y 0,06290 dólares. En particular, un cierre semanal de la barra por debajo del nivel de 0,07480 dólares, que jugó un papel importante en la formación de las dos últimas barras, podría generar una presión de venta significativa sobre el precio de DOGE.
The most important resistance levels to watch on the DOGE chart are, in order; 0.08217 / 0.08960 and 0.09913 dollars. Especially, a weekly bar close above the 0.08217 dollar level, which intersects with the EMA 21 (blue line), will help the DOGE price gain momentum.
Los niveles de resistencia más importantes a observar en el gráfico DOGE son, en orden; 0,08217 / 0,08960 y 0,09913 dólares. Especialmente, un cierre de barra semanal por encima del nivel de 0,08217 dólares, que se cruza con la EMA 21 (línea azul), ayudará al precio de DOGE a ganar impulso.

The post first appeared on COINTURK NEWS: Dogecoin Price Analysis Amidst Market Developments
La publicación apareció por primera vez en COINTURK NEWS: Análisis de precios de Dogecoin en medio de la evolución del mercado


 Cryptos Newss
 DogeHome
 Crypto News Flash
 Crypto News Flash
 Crypto News Flash
 Optimisus
 DogeHome
 U.Today
 Thecryptoupdates


