


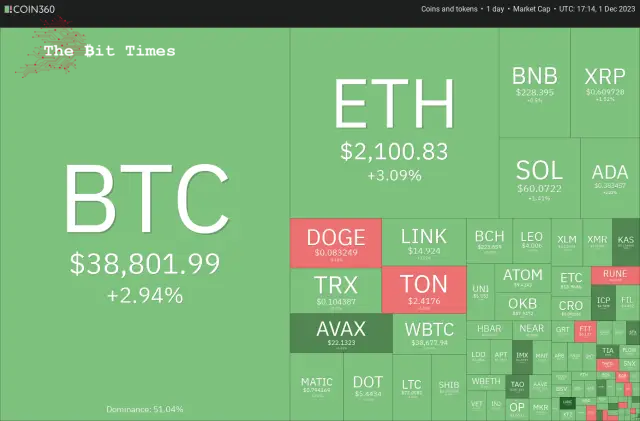
The price of Bitcoin reached a fresh high in 2023 on December 1st, and various alternative cryptocurrencies are following a similar upward trend. Could this signify the commencement of a potential Santa Claus rally in the cryptocurrency market?
El precio de Bitcoin alcanzó un nuevo máximo en 2023 el 1 de diciembre, y varias criptomonedas alternativas están siguiendo una tendencia alcista similar. ¿Podría esto significar el comienzo de un posible repunte de Papá Noel en el mercado de las criptomonedas?
Bitcoin experienced a notable 9% surge in November, encountering significant resistance at the $38,000 mark. Repeated efforts by buyers to sustain prices above this level have been met with relentless resistance from bearish forces. Historically, the month of December has produced mixed results. Data from Coinglass over the last five years indicates that Bitcoin saw a notable increase only in 2020, with an impressive rise of 46.92%. This year, the bulls will aim to replicate at least a portion of that remarkable performance.
Bitcoin experimentó un notable aumento del 9% en noviembre, encontrando una resistencia significativa en la marca de los 38.000 dólares. Los repetidos esfuerzos de los compradores por mantener los precios por encima de este nivel se han topado con una resistencia implacable de las fuerzas bajistas. Históricamente, el mes de diciembre ha producido resultados mixtos. Los datos de Coinglass de los últimos cinco años indican que Bitcoin experimentó un aumento notable solo en 2020, con un impresionante aumento del 46,92%. Este año, los alcistas intentarán replicar al menos una parte de ese notable desempeño.
As we approach the new year, several analysts hold an optimistic view of Bitcoin’s future. In a research note dated November 28th, Standard Chartered suggested that the potential approval of spot Bitcoin exchange-traded funds ahead of schedule could propel Bitcoin’s price to $100,000 by the conclusion of 2024.
A medida que nos acercamos al nuevo año, varios analistas tienen una visión optimista del futuro de Bitcoin. En una nota de investigación fechada el 28 de noviembre, Standard Chartered sugirió que la posible aprobación de fondos cotizados en bolsa de Bitcoin antes de lo previsto podría impulsar el precio de Bitcoin a 100.000 dólares a finales de 2024.
Galaxy Digital CEO Mike Novogratz also sounded upbeat about Bitcoin while speaking to Bloomberg on November 29th. He said that the marketing team of asset managers whose ETFs are approved will try to convince people to invest in Bitcoin, which could boost adoption. Additionally, the Federal Reserve cutting rates may act as a further trigger that could send Bitcoin’s price near an all-time high by this time next year.
El director ejecutivo de Galaxy Digital, Mike Novogratz, también se mostró optimista sobre Bitcoin mientras hablaba con Bloomberg el 29 de noviembre. Dijo que el equipo de marketing de los administradores de activos cuyos ETF sean aprobados intentará convencer a la gente para que invierta en Bitcoin, lo que podría impulsar la adopción. Además, el recorte de tipos de la Reserva Federal puede actuar como un detonante adicional que podría hacer que el precio de Bitcoin se acerque a un máximo histórico para estas fechas el próximo año.
Could Bitcoin sustain above $38,000 and clear the path for a rally to $40,000, or will bears again play spoilsport?
¿Podría Bitcoin mantenerse por encima de los 38.000 dólares y despejar el camino para un repunte hasta los 40.000 dólares, o los bajistas volverán a jugar aguafiestas?
Bitcoin (BTC) price analysis
Análisis de precios de Bitcoin (BTC)
The repeated retest of a resistance level tends to weaken it. After several failed attempts, the bulls kicked the price higher on December 1st. This indicates the resumption of the uptrend.
La repetición repetida de un nivel de resistencia tiende a debilitarlo. Después de varios intentos fallidos, los alcistas hicieron subir el precio el 1 de diciembre. Esto indica la reanudación de la tendencia alcista.
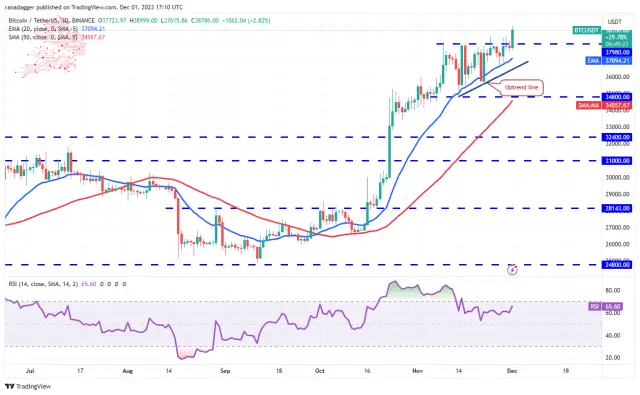
The rally above $37,980 completes an ascending triangle pattern. The BTC/USDT pair could rise to $40,000, again likely to act as a formidable resistance. If this level is scaled, the pair may reach the pattern target of $41,160. The rising moving averages and the relative strength index (RSI) above 65 indicate that bulls are in control.
El repunte por encima de $37,980 completa un patrón de triángulo ascendente. El par BTC/USDT podría subir a $40,000, lo que nuevamente probablemente actuará como una resistencia formidable. Si se escala este nivel, el par puede alcanzar el objetivo del patrón de $41,160. Los promedios móviles ascendentes y el índice de fuerza relativa (RSI) por encima de 65 indican que los alcistas tienen el control.
This optimistic view will be invalidated soon if the price turns down and dips below the uptrend line. That could invalidate the bullish setup, pulling the price down to the solid support at $34,800. A break below this level will signal that the Bears are back in the game.
Esta visión optimista pronto quedará invalidada si el precio baja y cae por debajo de la línea de tendencia alcista. Eso podría invalidar la configuración alcista, haciendo caer el precio hasta el sólido soporte de $ 34,800. Una ruptura por debajo de este nivel indicará que los Bears están de vuelta en el juego.
Ether (ETH) price analysis
Análisis de precios de éter (ETH)
Ether rebotó en la EMA de 20 días ($2019) el 30 de noviembre, lo que indica que los compradores defienden el nivel con vigor.
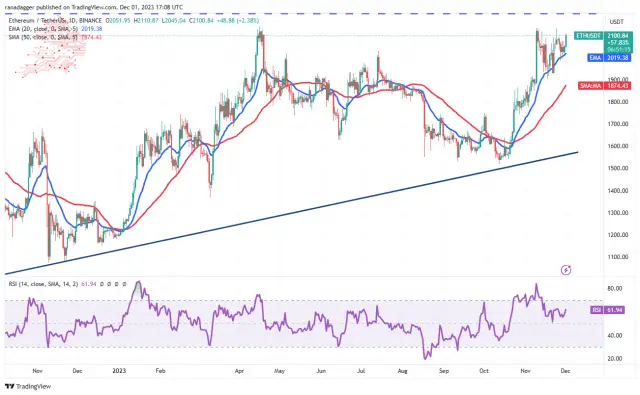
The bulls will try to push the price to the overhead resistance at $2,200. This remains the critical level to monitor in the near term. The ETH/USDT pair will complete an ascending triangle pattern if buyers bulldoze through. This bullish setup has a target objective of $3,400.
Los alcistas intentarán llevar el precio a la resistencia superior de 2200 dólares. Este sigue siendo el nivel crítico a monitorear en el corto plazo. El par ETH/USDT completará un patrón de triángulo ascendente si los compradores avanzan. Esta configuración alcista tiene un objetivo de $ 3,400.
The 20-day EMA is the crucial support on the downside. A break below this level will be the first sign that the bulls are losing their grip. The pair may then decline to the 50-day SMA ($1,874).
La EMA de 20 días es el soporte crucial a la baja. Una ruptura por debajo de este nivel será la primera señal de que los alcistas están perdiendo el control. Luego, el par puede caer hasta la SMA de 50 días ($1,874).
BNB price analysis
Análisis de precios de BNB
BNB has been trading inside the tight range between $223 and $239 for the past few days. This shows uncertainty among the bulls and the bears.
BNB ha estado cotizando dentro del estrecho rango entre 223 y 239 dólares durante los últimos días. Esto muestra incertidumbre entre los alcistas y los bajistas.
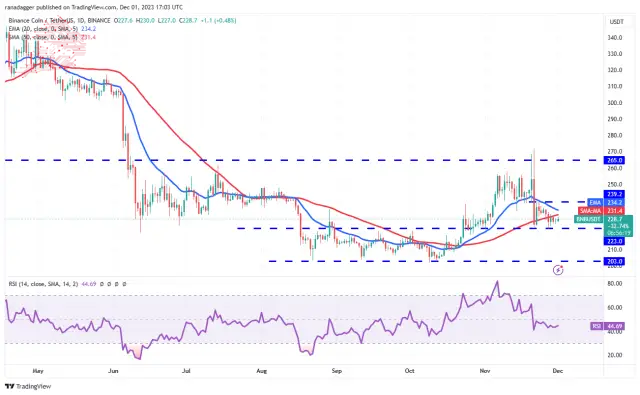
The downsloping 20-day EMA ($234) and the RSI in the negative area suggest that the bears are in command. Any recovery attempt is likely to face selling at the 20-day EMA. If the price turns down from this level, the possibility of a drop below $223 increases. That may start a decline to $203.
La EMA de 20 días ($ 234) descendente y el RSI en el área negativa sugieren que los bajistas tienen el mando. Es probable que cualquier intento de recuperación enfrente ventas en la EMA de 20 días. Si el precio baja desde este nivel, aumenta la posibilidad de una caída por debajo de $ 223. Eso puede iniciar una caída a 203 dólares.
Instead, if buyers shove the price above the 20-day EMA, the BNB/USDT pair may rise to $239. A break and close above this level could start a rally toward $265.
En cambio, si los compradores empujan el precio por encima de la EMA de 20 días, el par BNB/USDT puede subir a $239. Una ruptura y un cierre por encima de este nivel podrían iniciar un repunte hacia los 265 dólares.
XRP price analysis
XRP has been clinging to the 20-day EMA ($0.61) for the past few days. This suggests that every minor dip is being purchased. It enhances the prospects of a break above the 20-day EMA.
Análisis de precios de XRP XRP se ha aferrado a la EMA de 20 días ($ 0,61) durante los últimos días. Esto sugiere que se está comprando cada pequeña caída. Mejora las perspectivas de una ruptura por encima de la EMA de 20 días.
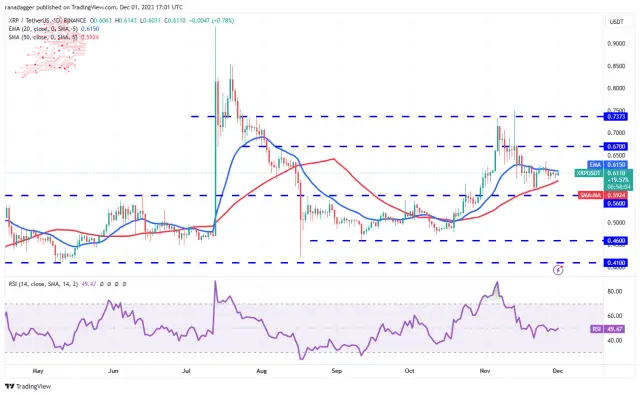
If that happens, it will suggest that the advantage has tilted toward the bulls. The XRP/USDT pair may rise to $0.64 and later to $0.67. This level may act as a minor roadblock, but the pair may touch $0.74 if overcome.
Si eso sucede, sugerirá que la ventaja se ha inclinado hacia los alcistas. El par XRP/USDT puede subir a $0,64 y luego a $0,67. Este nivel puede actuar como un obstáculo menor, pero el par puede tocar USD 0,74 si se supera.
Contrarily, if buyers fail to propel the price above the 20-day EMA, it will suggest that sellers have flipped the level into resistance. The pair may then descend to the solid support at $0.56.
Por el contrario, si los compradores no logran impulsar el precio por encima de la EMA de 20 días, sugerirá que los vendedores han convertido el nivel en resistencia. Luego, el par puede descender hasta el soporte sólido de 0,56 dólares.
Solana (SOL) price analysis
Análisis de precios de Solana (SOL)
The bears sold the rally to $62 on Nov. 29 and 30, but they could not sustain Solana below $59. This suggests buying at lower levels.
Los bajistas vendieron el repunte a 62 dólares el 29 y 30 de noviembre, pero no pudieron mantener a Solana por debajo de 59 dólares. Esto sugiere comprar a niveles más bajos.
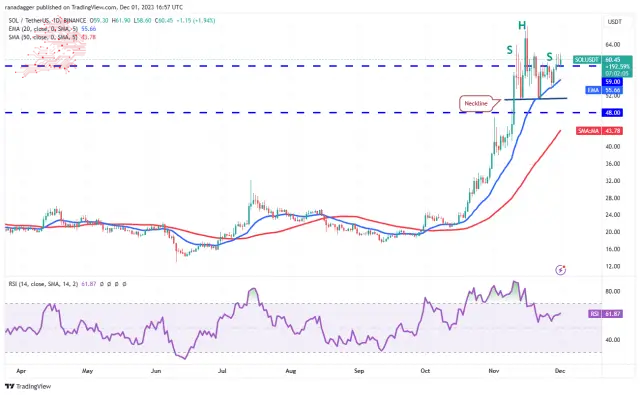
The upsloping 20-day EMA ($55.66) and the RSI in the positive territory indicate that the bulls have the upper hand. That improves the prospects of a rally above $62.10. If that happens, the SOL/USDT pair may reach $68. The bulls will have to defend this level with all their might because a break above it will clear the path for a rally to $100.
La EMA de 20 días al alza (USD 55,66) y el RSI en territorio positivo indican que los alcistas tienen la ventaja. Eso mejora las perspectivas de un repunte por encima de 62,10 dólares. Si eso sucede, el par SOL/USDT puede alcanzar los $68. Los alcistas tendrán que defender este nivel con todas sus fuerzas porque una ruptura por encima de él despejará el camino para un repunte hasta los 100 dólares.
The immediate support to watch on the downside is the 20-day EMA. If this level cracks, the pair may tumble to $51. The bears must yank the price below this level to start a deeper correction.
El soporte inmediato a tener en cuenta a la baja es la EMA de 20 días. Si este nivel se rompe, el par puede caer a $51. Los bajistas deben tirar el precio por debajo de este nivel para iniciar una corrección más profunda.
Cardano (ADA) price analysis
Cardano has been taking support at the 20-day EMA ($0.37), but the Bulls are struggling to start a strong rebound off it. This suggests a lack of demand at higher levels.
Análisis de precios de Cardano (ADA) Cardano ha estado recibiendo soporte en la EMA de 20 días ($0,37), pero los Bulls están luchando por iniciar un fuerte rebote a partir de ella. Esto sugiere una falta de demanda en los niveles más altos.
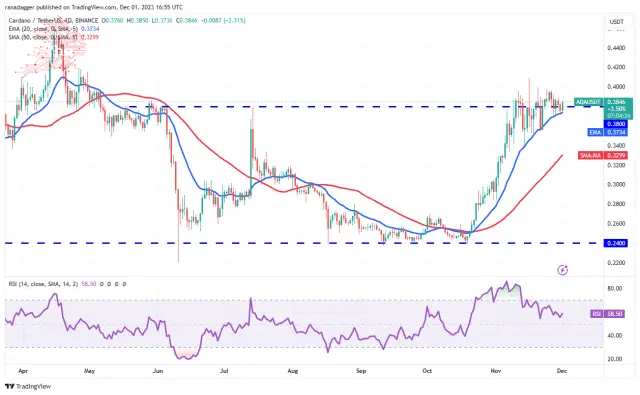
The price has been squeezed between the 20-day EMA and the overhead resistance at $0.40. The gradually upsloping 20-day EMA and the RSI above 58 indicate that bulls have an edge. If buyers pierce the overhead resistance at $0.40, the bullish momentum may pick up, and the ADA/USDT pair may jump to $0.42 and subsequently to $0.46.
El precio se ha visto comprimido entre la EMA de 20 días y la resistencia superior de 0,40 dólares. La EMA de 20 días que sube gradualmente y el RSI por encima de 58 indican que los alcistas tienen una ventaja. Si los compradores perforan la resistencia superior de 0,40 dólares, el impulso alcista puede aumentar y el par ADA/USDT puede saltar a 0,42 dólares y posteriormente a 0,46 dólares.
Contrarily, if the price skids below the 20-day EMA, it will suggest profit-booking by short-term traders. The pair may then slump to $0.34, where the bulls will try to arrest the decline.
Por el contrario, si el precio cae por debajo de la EMA de 20 días, sugerirá que los operadores a corto plazo estén reservando ganancias. Luego, el par puede caer a 0,34 dólares, donde los alcistas intentarán detener la caída.
Dogecoin (DOGE) price analysis
Análisis de precios de Dogecoin (DOGE)
Dogecoin has maintained above $0.08 for the past four days, indicating that the bulls are not hurrying to book profits.
Dogecoin se ha mantenido por encima de 0,08 dólares durante los últimos cuatro días, lo que indica que los alcistas no se apresuran a registrar ganancias.
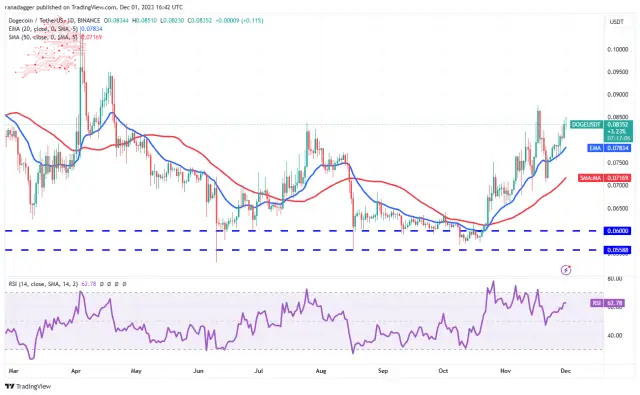
The rising 20-day EMA ($0.08) and the RSI above 62 indicate that bulls remain in command. Buyers will try to push the price to the psychological resistance of $0.10. There is a minor obstacle at $0.09, but it is likely to be crossed. Sellers are expected to mount a vigorous defence in the $0.10 to $0.11 zone.
La EMA de 20 días en ascenso ($0,08) y el RSI por encima de 62 indican que los alcistas siguen al mando. Los compradores intentarán llevar el precio a la resistencia psicológica de 0,10 dólares. Hay un obstáculo menor en 0,09$, pero es probable que se supere. Se espera que los vendedores monten una vigorosa defensa en la zona de 0,10 a 0,11 dólares.
The 20-day EMA is the crucial support to watch out for on the downside. If this level gives way, the DOGE/USDT pair may drop to the 50-day SMA ($0.07).
La EMA de 20 días es el soporte crucial al que hay que prestar atención a la baja. Si este nivel cede, el par DOGE/USDT puede caer a la SMA de 50 días ($0,07).
Toncoin (TON) price analysis
Toncoin has been sustaining above the 20-day EMA ($2.38) for the past few days, but the up-move lacks momentum.
Análisis de precios de Toncoin (TON) Toncoin se ha mantenido por encima de la EMA de 20 días ($2,38) durante los últimos días, pero el movimiento ascendente carece de impulso.
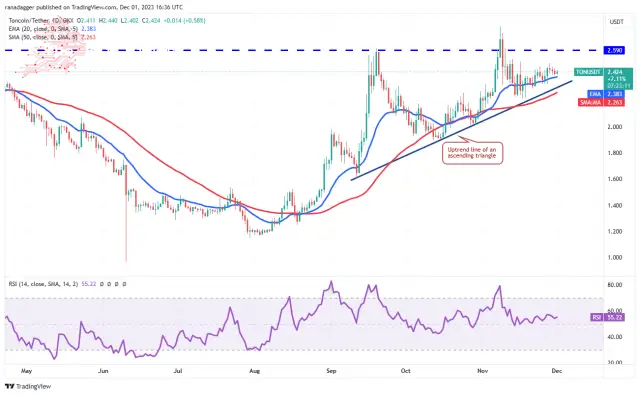
The 20-day EMA slopes gradually, and the RSI is near 55, indicating that the bulls have a slight edge. Buyers will try to propel the price above $2.59 and complete the ascending triangle pattern. This bullish setup has a target objective of $3.58.
La EMA de 20 días desciende gradualmente y el RSI está cerca de 55, lo que indica que los alcistas tienen una ligera ventaja. Los compradores intentarán impulsar el precio por encima de 2,59 dólares y completar el patrón de triángulo ascendente. Esta configuración alcista tiene un objetivo de 3,58 dólares.
On the contrary, a slide below the uptrend line will invalidate the bullish triangle pattern. The failure of a bullish setup is a bearish sign, which could drag the TON/USDT pair toward the next significant support at $1.89.
Por el contrario, una caída por debajo de la línea de tendencia alcista invalidará el patrón de triángulo alcista. El fracaso de una configuración alcista es una señal bajista, lo que podría arrastrar al par TON/USDT hacia el próximo soporte significativo en 1,89 dólares.
Chainlink (LINK) price analysis
Chainlink’s price is squeezed between the 20-day EMA ($14.19) and the overhead resistance of $15.40 for the past few days.
Análisis de precios de Chainlink (LINK) El precio de Chainlink se encuentra comprimido entre la EMA de 20 días ($14,19) y la resistencia superior de $15,40 durante los últimos días.
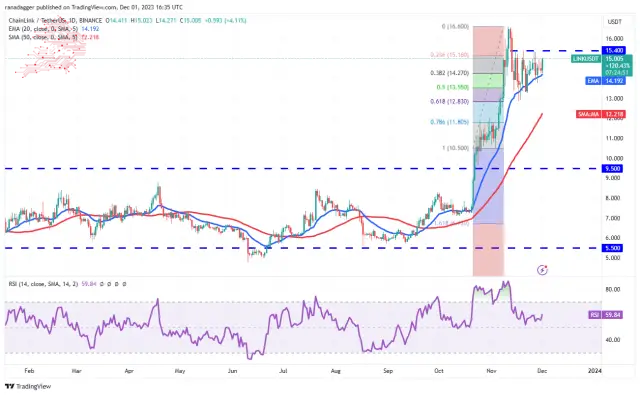
The upsloping 20-day EMA and the RSI in the positive zone indicate that the path of least resistance is to the upside. If buyers overcome the barrier at $15.40, the LINK/USDT pair could climb to $16.60 and dash toward $18.30.
La EMA de 20 días al alza y el RSI en la zona positiva indican que el camino de menor resistencia es al alza. Si los compradores superan la barrera de 15,40 dólares, el par LINK/USDT podría subir a 16,60 dólares y precipitarse hacia 18,30 dólares.
The first sign of weakness will be a break and close below the 20-day EMA. That could start a decline toward the 61.8% Fibonacci retracement level of $12.83. This level is likely to attract aggressive buying by the bulls.
La primera señal de debilidad será una ruptura y un cierre por debajo de la EMA de 20 días. Eso podría iniciar una caída hacia el nivel de retroceso de Fibonacci del 61,8% de 12,83 dólares. Es probable que este nivel atraiga compras agresivas por parte de los alcistas.
Avalanche (AVAX) price analysis
Buyers pushed Avalanche above the $22 resistance on December 1st, indicating higher-level solid demand.
Análisis de precios de Avalanche (AVAX) Los compradores empujaron a Avalanche por encima de la resistencia de 22 dólares el 1 de diciembre, lo que indica una demanda sólida de mayor nivel.
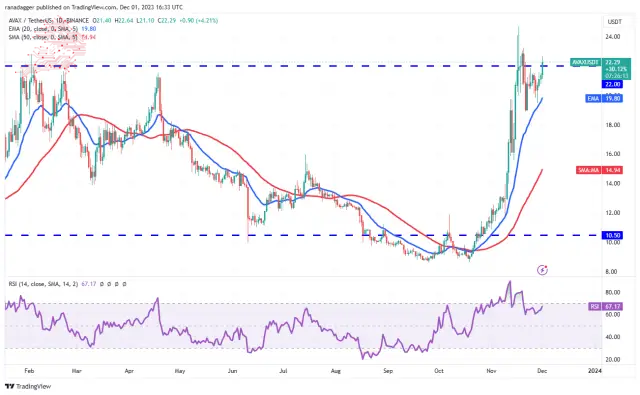
If the price closes above $22, it will increase the likelihood of a rally to $24.69. Sellers are expected to mount a vigorous defence at this level because a break above it could open the doors for a potential rally to $28.50.
Si el precio cierra por encima de 22 dólares, aumentará la probabilidad de un repunte a 24,69 dólares. Se espera que los vendedores monten una defensa vigorosa en este nivel porque una ruptura por encima de él podría abrir las puertas a un posible repunte hasta los 28,50 dólares.
Bears must quickly pull the AVAX/USDT pair back below the 20-day EMA ($19.80) if they want to halt the uptrend. That may trigger stops of several short-term traders, resulting in a drop to $18.90.
Los bajistas deben hacer retroceder rápidamente el par AVAX/USDT por debajo de la EMA de 20 días ($19,80) si quieren detener la tendencia alcista. Esto puede provocar paradas de varios operadores a corto plazo, lo que resultaría en una caída a 18,90 dólares.
Source – Rakesh Upadhyay
Fuente - Rakesh Upadhyay
Source: https://thebittimes.com/latest-market-overview-1st-dec-btc-eth-bnb-xrp-sol-ada-doge-ton-link-avax-tbt72406.html
Fuente: https://thebittimes.com/latest-market-overview-1st-dec-btc-eth-bnb-xrp-sol-ada-doge-ton-link-avax-tbt72406.html
 DogeHome
 Crypto News Land
 Crypto Daily™
 Crypto Intelligence
 Crypto Daily™
 CaptainAltcoin
 Thecryptoupdates
 Crypto Intelligence
 CoinsProbe


