


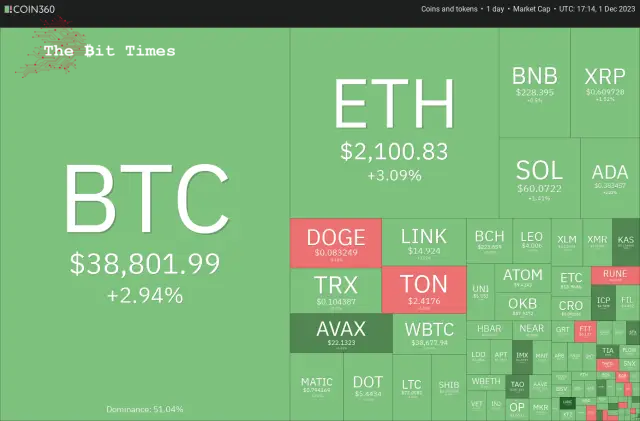
The price of Bitcoin reached a fresh high in 2023 on December 1st, and various alternative cryptocurrencies are following a similar upward trend. Could this signify the commencement of a potential Santa Claus rally in the cryptocurrency market?
ビットコインの価格は12月1日に2023年の最高値に達し、さまざまな代替仮想通貨も同様の上昇傾向をたどっています。これは仮想通貨市場で潜在的なサンタクロースの集会が始まることを意味しているのだろうか?
Bitcoin experienced a notable 9% surge in November, encountering significant resistance at the $38,000 mark. Repeated efforts by buyers to sustain prices above this level have been met with relentless resistance from bearish forces. Historically, the month of December has produced mixed results. Data from Coinglass over the last five years indicates that Bitcoin saw a notable increase only in 2020, with an impressive rise of 46.92%. This year, the bulls will aim to replicate at least a portion of that remarkable performance.
ビットコインは11月に9%という顕著な急騰を経験し、3万8000ドルの水準で大きな抵抗に遭遇した。この水準を上回る価格を維持しようとする買い手による度重なる努力は、弱気勢力の容赦ない抵抗に遭っている。歴史的に、12 月はさまざまな結果を生み出してきました。過去 5 年間の Coinglass のデータによると、ビットコインは 2020 年にのみ顕著な増加を示し、46.92% という目覚ましい上昇を示しました。今年、雄牛たちはその驚くべきパフォーマンスの少なくとも一部を再現することを目指すだろう。
As we approach the new year, several analysts hold an optimistic view of Bitcoin’s future. In a research note dated November 28th, Standard Chartered suggested that the potential approval of spot Bitcoin exchange-traded funds ahead of schedule could propel Bitcoin’s price to $100,000 by the conclusion of 2024.
新年が近づくにつれ、何人かのアナリストがビットコインの将来について楽観的な見方をしています。スタンダードチャータードは11月28日付のリサーチノートで、スポットビットコイン上場投資信託が予定より前倒しで承認される可能性があれば、2024年末までにビットコイン価格が10万ドルに上昇する可能性があると示唆した。
Galaxy Digital CEO Mike Novogratz also sounded upbeat about Bitcoin while speaking to Bloomberg on November 29th. He said that the marketing team of asset managers whose ETFs are approved will try to convince people to invest in Bitcoin, which could boost adoption. Additionally, the Federal Reserve cutting rates may act as a further trigger that could send Bitcoin’s price near an all-time high by this time next year.
Galaxy Digital CEOのMike Novogratz氏も、11月29日にブルームバーグとのインタビューでビットコインについて楽観的な発言をした。同氏は、ETFが承認されている資産運用会社のマーケティングチームが人々にビットコインへの投資を説得しようとするため、導入が促進される可能性があると述べた。さらに、連邦準備理事会の利下げがさらなる引き金となり、来年の今頃までにビットコインの価格が史上最高値近くになる可能性があります。
Could Bitcoin sustain above $38,000 and clear the path for a rally to $40,000, or will bears again play spoilsport?
ビットコインは38,000ドルを超えて維持し、40,000ドルへの上昇への道を切り開くことができるだろうか、それとも弱気派は再び戦利品をプレイするだろうか?
Bitcoin (BTC) price analysis
ビットコイン(BTC)価格分析
The repeated retest of a resistance level tends to weaken it. After several failed attempts, the bulls kicked the price higher on December 1st. This indicates the resumption of the uptrend.
抵抗レベルの再テストを繰り返すと、抵抗レベルが弱くなる傾向があります。何度かの試みが失敗した後、強気派は12月1日に価格を引き上げた。これは上昇トレンドの再開を示しています。
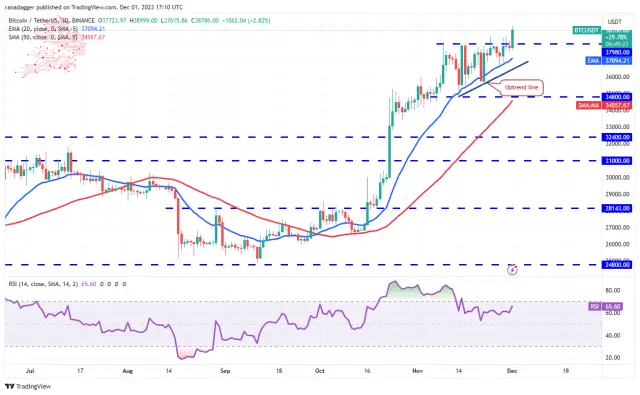
The rally above $37,980 completes an ascending triangle pattern. The BTC/USDT pair could rise to $40,000, again likely to act as a formidable resistance. If this level is scaled, the pair may reach the pattern target of $41,160. The rising moving averages and the relative strength index (RSI) above 65 indicate that bulls are in control.
37,980ドルを超えると上昇トライアングルパターンが完成します。 BTC/USDTペアは40,000ドルまで上昇する可能性があり、再び手強い抵抗線となる可能性が高い。このレベルが拡大すると、ペアはパターン目標の41,160ドルに到達する可能性があります。移動平均の上昇と相対力指数(RSI)が65を超えていることは、強気派が主導権を握っていることを示している。
This optimistic view will be invalidated soon if the price turns down and dips below the uptrend line. That could invalidate the bullish setup, pulling the price down to the solid support at $34,800. A break below this level will signal that the Bears are back in the game.
価格が下落して上昇トレンドラインを下回った場合、この楽観的な見方はすぐに無効になるでしょう。そうなると強気の設定が無効となり、価格は堅実なサポートである34,800ドルまで引き下げられる可能性がある。このレベルを下回ると、ベアーズがゲームに戻ってきたことを示すでしょう。
Ether (ETH) price analysis
イーサ(ETH)価格分析
イーサは11月30日に20日間EMA(2,019ドル)から反発し、買い手が精力的にその水準を守っていることを示しています。
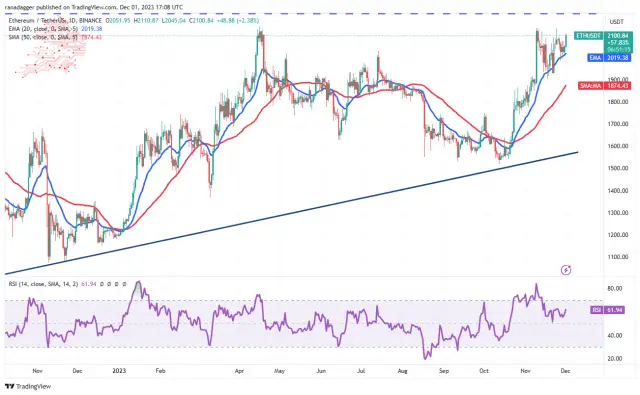
The bulls will try to push the price to the overhead resistance at $2,200. This remains the critical level to monitor in the near term. The ETH/USDT pair will complete an ascending triangle pattern if buyers bulldoze through. This bullish setup has a target objective of $3,400.
強気派は価格を2,200ドルの頭上の抵抗線まで押し上げようとするだろう。これは依然として短期的に監視すべき重要なレベルである。買い手が強行突破すれば、ETH/USDTペアは上昇トライアングルパターンを完成させることになる。この強気の設定では、目標目標を 3,400 ドルとしています。
The 20-day EMA is the crucial support on the downside. A break below this level will be the first sign that the bulls are losing their grip. The pair may then decline to the 50-day SMA ($1,874).
20日間EMAは下値の重要なサポートとなる。この水準を下回ると、強気派が主導権を失いつつあることを示す最初の兆候となるだろう。その後、ペアは50日間SMA(1,874ドル)まで下落する可能性がある。
BNB price analysis
BNB価格分析
BNB has been trading inside the tight range between $223 and $239 for the past few days. This shows uncertainty among the bulls and the bears.
BNBはここ数日間、223ドルから239ドルの間の狭いレンジ内で取引されている。これは強気派と弱気派の間の不確実性を示している。
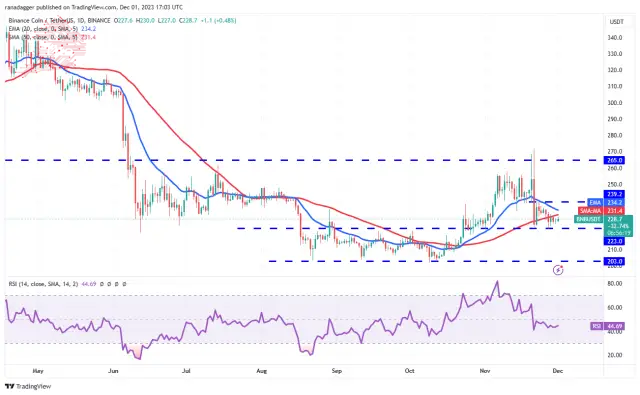
The downsloping 20-day EMA ($234) and the RSI in the negative area suggest that the bears are in command. Any recovery attempt is likely to face selling at the 20-day EMA. If the price turns down from this level, the possibility of a drop below $223 increases. That may start a decline to $203.
下り坂の20日間EMA(234ドル)とマイナス圏にあるRSIは、弱気派が主導権を握っていることを示唆している。回復を試みても、20日間EMAでは売りに直面する可能性が高い。この水準から下落に転じた場合、223ドルを割り込む可能性が高まる。そうなると203ドルまで下落が始まるかもしれない。
Instead, if buyers shove the price above the 20-day EMA, the BNB/USDT pair may rise to $239. A break and close above this level could start a rally toward $265.
代わりに、買い手が価格を20日間EMAを超えて押し上げた場合、BNB/USDTペアは239ドルまで上昇する可能性があります。このレベルを上抜けて終値を迎えると、265ドルに向けて上昇が始まる可能性がある。
XRP price analysis
XRP has been clinging to the 20-day EMA ($0.61) for the past few days. This suggests that every minor dip is being purchased. It enhances the prospects of a break above the 20-day EMA.
XRP価格分析 XRPはここ数日間、20日間EMA(0.61ドル)に張り付いている。これは、あらゆる小さな下落が購入されていることを示唆しています。これにより、20日間EMAを上回る可能性が高まりました。
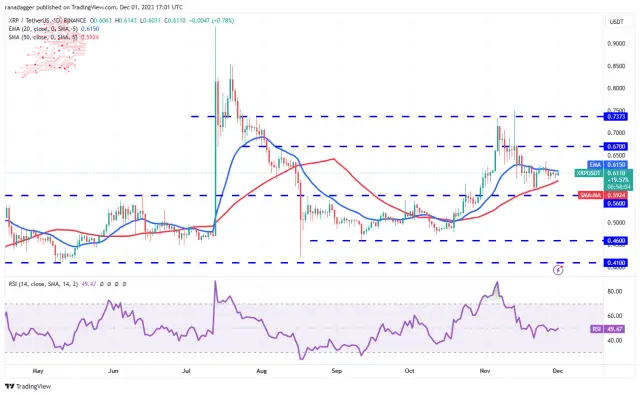
If that happens, it will suggest that the advantage has tilted toward the bulls. The XRP/USDT pair may rise to $0.64 and later to $0.67. This level may act as a minor roadblock, but the pair may touch $0.74 if overcome.
そうなれば、優位性が強気派に傾いたことを示唆することになる。 XRP/USDTペアは0.64ドルまで上昇し、その後は0.67ドルまで上昇する可能性がある。このレベルは小さな障害として機能する可能性がありますが、克服できれば0.74ドルに達する可能性があります。
Contrarily, if buyers fail to propel the price above the 20-day EMA, it will suggest that sellers have flipped the level into resistance. The pair may then descend to the solid support at $0.56.
逆に、買い手が価格を20日間EMAを超えて押し上げることができなかった場合は、売り手がそのレベルを抵抗線に変えたことを示唆するでしょう。その後、ペアは0.56ドルの堅実なサポートまで下降する可能性があります。
Solana (SOL) price analysis
ソラナ (SOL) 価格分析
The bears sold the rally to $62 on Nov. 29 and 30, but they could not sustain Solana below $59. This suggests buying at lower levels.
弱気派は11月29日と30日にラリーを62ドルまで売ったが、ソラナを59ドル以下に維持することはできなかった。これは、より低いレベルでの購入を示唆しています。
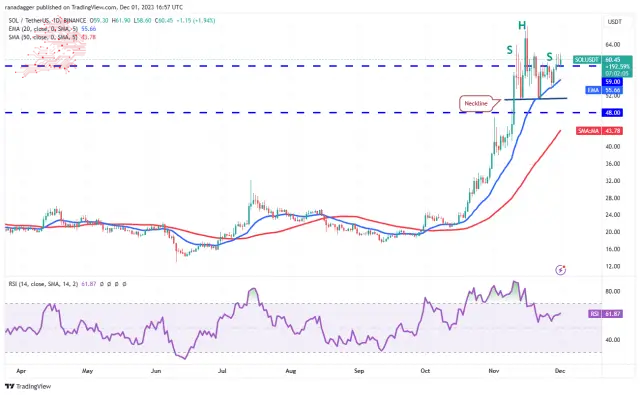
The upsloping 20-day EMA ($55.66) and the RSI in the positive territory indicate that the bulls have the upper hand. That improves the prospects of a rally above $62.10. If that happens, the SOL/USDT pair may reach $68. The bulls will have to defend this level with all their might because a break above it will clear the path for a rally to $100.
20日間EMA(55.66ドル)が右肩上がりで、RSIがプラス圏にあることは、強気派が優勢であることを示している。これにより、62.10ドルを超える上昇の見通しが改善される。そうなれば、SOL/USDTペアは68ドルに達する可能性がある。この水準を突破すれば100ドルへの上昇への道が開かれるため、強気派はこの水準を全力で守らなければならないだろう。
The immediate support to watch on the downside is the 20-day EMA. If this level cracks, the pair may tumble to $51. The bears must yank the price below this level to start a deeper correction.
下値で注目すべき当面のサポートは 20 日間 EMA です。このレベルが割れた場合、ペアは51ドルまで下落する可能性がある。弱気派はさらに深い調整を開始するには、価格をこのレベル以下に引き下げる必要がある。
Cardano (ADA) price analysis
Cardano has been taking support at the 20-day EMA ($0.37), but the Bulls are struggling to start a strong rebound off it. This suggests a lack of demand at higher levels.
カルダノ(ADA)の価格分析 カルダノは20日間EMA(0.37ドル)でサポートを受けていますが、ブルズはそこから力強い反発を始めるのに苦労しています。これは、より高いレベルでの需要が不足していることを示唆しています。
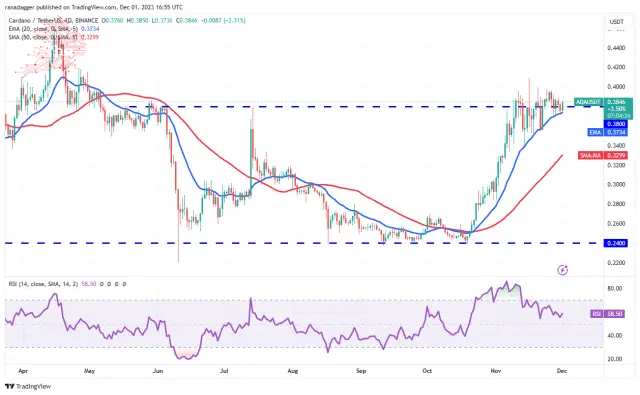
The price has been squeezed between the 20-day EMA and the overhead resistance at $0.40. The gradually upsloping 20-day EMA and the RSI above 58 indicate that bulls have an edge. If buyers pierce the overhead resistance at $0.40, the bullish momentum may pick up, and the ADA/USDT pair may jump to $0.42 and subsequently to $0.46.
価格は20日間EMAと0.40ドルの直上の抵抗線の間に圧迫されている。徐々に右肩上がりの20日間EMAと58を超えるRSIは、強気派が有利であることを示しています。買い手が0.40ドルの頭上の抵抗線を突破した場合、強気の勢いが加速する可能性があり、ADA/USDTペアは0.42ドル、その後0.46ドルに跳ね上がる可能性がある。
Contrarily, if the price skids below the 20-day EMA, it will suggest profit-booking by short-term traders. The pair may then slump to $0.34, where the bulls will try to arrest the decline.
逆に、価格が20日間EMAを下回った場合は、短期トレーダーによる利益確定を示唆することになります。その後、ペアは0.34ドルまで下落する可能性があり、強気派は下落を阻止しようとするだろう。
Dogecoin (DOGE) price analysis
ドージコイン (DOGE) 価格分析
Dogecoin has maintained above $0.08 for the past four days, indicating that the bulls are not hurrying to book profits.
ドージコインは過去4日間0.08ドル以上を維持しており、強気派が利益確定を急いでいないことを示している。
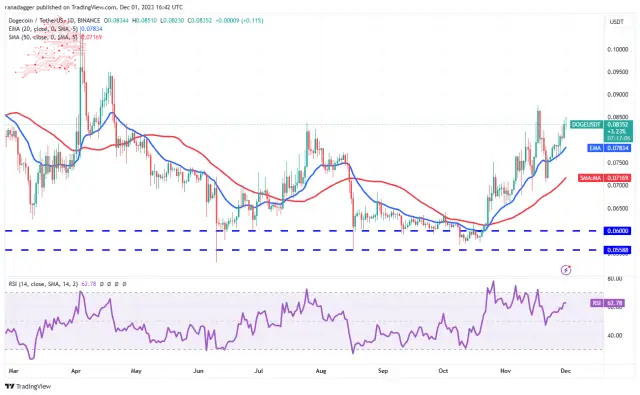
The rising 20-day EMA ($0.08) and the RSI above 62 indicate that bulls remain in command. Buyers will try to push the price to the psychological resistance of $0.10. There is a minor obstacle at $0.09, but it is likely to be crossed. Sellers are expected to mount a vigorous defence in the $0.10 to $0.11 zone.
20日間EMA(0.08ドル)の上昇とRSIが62を超えていることは、強気派が依然として主導権を握っていることを示している。買い手は価格を0.10ドルの心理的抵抗値まで押し上げようとするだろう。 0.09ドルに小さな障害がありますが、おそらく越えられるでしょう。売り手は0.10ドルから0.11ドルのゾーンで精力的な防衛を開始すると予想される。
The 20-day EMA is the crucial support to watch out for on the downside. If this level gives way, the DOGE/USDT pair may drop to the 50-day SMA ($0.07).
20日間EMAは、下値に注意すべき重要なサポートです。このレベルが崩れた場合、DOGE/USDTペアは50日SMA(0.07ドル)まで下落する可能性がある。
Toncoin (TON) price analysis
Toncoin has been sustaining above the 20-day EMA ($2.38) for the past few days, but the up-move lacks momentum.
トンコイン(TON)の価格分析 トンコインはここ数日間、20日間EMA(2.38ドル)を上回って推移しているが、上昇には勢いが欠けている。
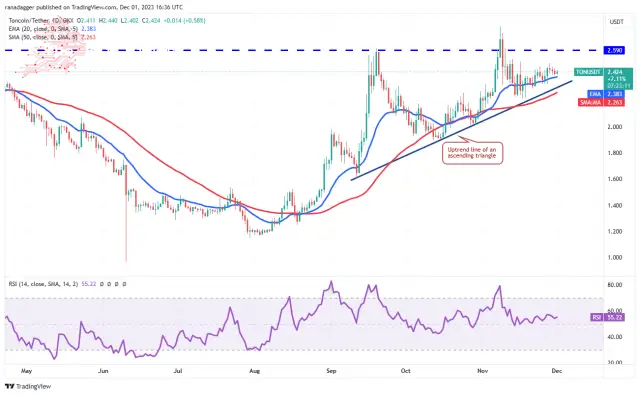
The 20-day EMA slopes gradually, and the RSI is near 55, indicating that the bulls have a slight edge. Buyers will try to propel the price above $2.59 and complete the ascending triangle pattern. This bullish setup has a target objective of $3.58.
20日間EMAは徐々に傾斜しており、RSIは55近くにあり、強気派がわずかに有利であることを示しています。買い手は価格を2.59ドル以上に押し上げ、上昇三角パターンを完成させようとするだろう。この強気の設定では、目標目標を 3.58 ドルとしています。
On the contrary, a slide below the uptrend line will invalidate the bullish triangle pattern. The failure of a bullish setup is a bearish sign, which could drag the TON/USDT pair toward the next significant support at $1.89.
逆に、上昇トレンドラインを下回ると、強気のトライアングルパターンは無効になります。強気のセットアップの失敗は弱気のサインであり、TON/USDTペアを次の重要なサポートである1.89ドルに向けて引っ張る可能性がある。
Chainlink (LINK) price analysis
Chainlink’s price is squeezed between the 20-day EMA ($14.19) and the overhead resistance of $15.40 for the past few days.
Chainlink(LINK)の価格分析 Chainlinkの価格は、過去数日間、20日間EMA(14.19ドル)と直上の抵抗線である15.40ドルの間に圧迫されています。
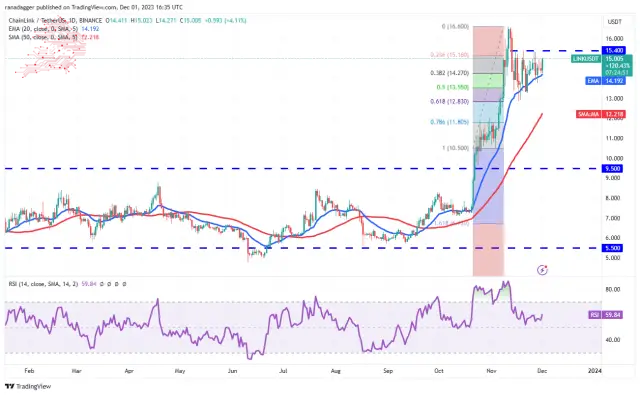
The upsloping 20-day EMA and the RSI in the positive zone indicate that the path of least resistance is to the upside. If buyers overcome the barrier at $15.40, the LINK/USDT pair could climb to $16.60 and dash toward $18.30.
20 日間の右肩上がりの EMA とプラスゾーンにある RSI は、抵抗が最も少ない経路が上向きであることを示しています。買い手が15.40ドルの壁を乗り越えれば、LINK/USDTペアは16.60ドルまで上昇し、18.30ドルに向けて猛ダッシュする可能性がある。
The first sign of weakness will be a break and close below the 20-day EMA. That could start a decline toward the 61.8% Fibonacci retracement level of $12.83. This level is likely to attract aggressive buying by the bulls.
弱さの最初の兆候はブレイクし、20日間EMAを下回って終了することだろう。これにより、61.8%のフィボナッチ・リトレースメント水準である12.83ドルに向けて下落が始まる可能性がある。この水準は強気派による積極的な買いを呼び込む可能性が高い。
Avalanche (AVAX) price analysis
Buyers pushed Avalanche above the $22 resistance on December 1st, indicating higher-level solid demand.
Avalanche(AVAX)の価格分析 買い手は12月1日にAvalancheを22ドルの抵抗線を超えて押し上げ、より高いレベルの堅調な需要を示しました。
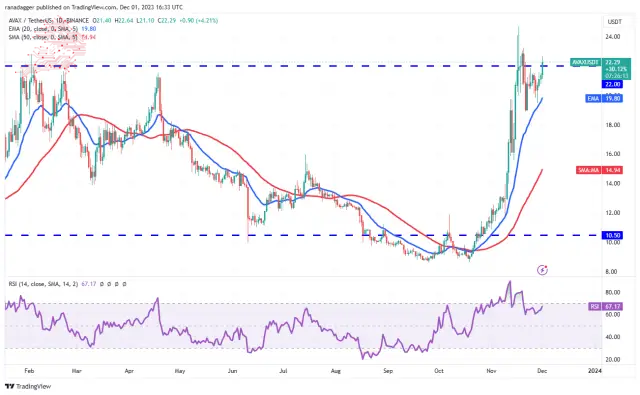
If the price closes above $22, it will increase the likelihood of a rally to $24.69. Sellers are expected to mount a vigorous defence at this level because a break above it could open the doors for a potential rally to $28.50.
価格が22ドルを超えて終了した場合、24.69ドルまで上昇する可能性が高まります。この水準を上抜ければ28.50ドルへの上昇の可能性が開かれる可能性があるため、売り手はこの水準で精力的な防衛を開始すると予想される。
Bears must quickly pull the AVAX/USDT pair back below the 20-day EMA ($19.80) if they want to halt the uptrend. That may trigger stops of several short-term traders, resulting in a drop to $18.90.
弱気派が上昇トレンドを止めたいのであれば、AVAX/USDTペアを20日間EMA(19.80ドル)以下に速やかに引き下げる必要がある。これにより複数の短期トレーダーがストップを引き起こし、結果的に18.90ドルまで下落する可能性がある。
Source – Rakesh Upadhyay
出典 – ラケシュ・ウパディヤイ
Source: https://thebittimes.com/latest-market-overview-1st-dec-btc-eth-bnb-xrp-sol-ada-doge-ton-link-avax-tbt72406.html
出典: https://thebittimes.com/latest-market-overview-1st-dec-btc-eth-bnb-xrp-sol-ada-doge-ton-link-avax-tbt72406.html
 Crypto News Land
 ETHNews
 CFN
CFN U_Today
 Thecoinrepublic.com
 DogeHome
 Optimisus
 Optimisus
 DeFi Planet


