
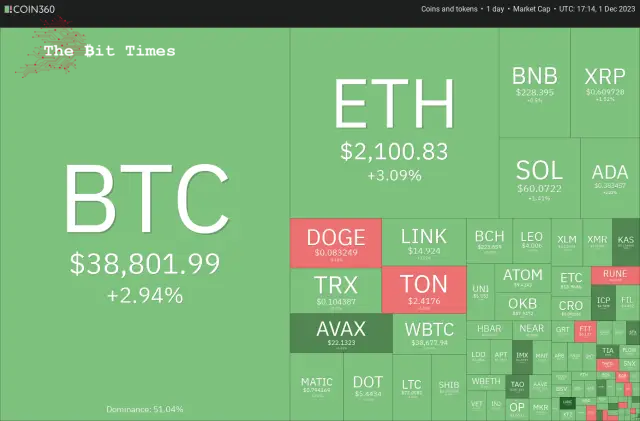
The price of Bitcoin reached a fresh high in 2023 on December 1st, and various alternative cryptocurrencies are following a similar upward trend. Could this signify the commencement of a potential Santa Claus rally in the cryptocurrency market?
12 月 1 日,比特币价格创下 2023 年新高,各种替代加密货币也遵循类似的上涨趋势。这是否意味着加密货币市场潜在的圣诞老人反弹的开始?
Bitcoin experienced a notable 9% surge in November, encountering significant resistance at the $38,000 mark. Repeated efforts by buyers to sustain prices above this level have been met with relentless resistance from bearish forces. Historically, the month of December has produced mixed results. Data from Coinglass over the last five years indicates that Bitcoin saw a notable increase only in 2020, with an impressive rise of 46.92%. This year, the bulls will aim to replicate at least a portion of that remarkable performance.
比特币在 11 月份经历了 9% 的显着飙升,在 38,000 美元关口遇到了重大阻力。买家一再努力将价格维持在这一水平之上,但遭到了看跌力量的不懈抵制。从历史上看,12 月份的结果好坏参半。 Coinglass过去五年的数据显示,比特币仅在2020年出现了显着增长,涨幅高达46.92%,令人印象深刻。今年,多头的目标是复制至少部分出色的表现。
As we approach the new year, several analysts hold an optimistic view of Bitcoin’s future. In a research note dated November 28th, Standard Chartered suggested that the potential approval of spot Bitcoin exchange-traded funds ahead of schedule could propel Bitcoin’s price to $100,000 by the conclusion of 2024.
随着新年的临近,一些分析师对比特币的未来持乐观态度。在 11 月 28 日的一份研究报告中,渣打银行表示,现货比特币交易所交易基金可能提前获得批准,这可能会在 2024 年底前将比特币的价格推升至 10 万美元。
Galaxy Digital CEO Mike Novogratz also sounded upbeat about Bitcoin while speaking to Bloomberg on November 29th. He said that the marketing team of asset managers whose ETFs are approved will try to convince people to invest in Bitcoin, which could boost adoption. Additionally, the Federal Reserve cutting rates may act as a further trigger that could send Bitcoin’s price near an all-time high by this time next year.
Galaxy Digital 首席执行官迈克·诺沃格拉茨 (Mike Novogratz) 在 11 月 29 日接受彭博社采访时也对比特币表示乐观。他表示,ETF 获得批准的资产管理公司的营销团队将试图说服人们投资比特币,这可能会促进比特币的采用。此外,美联储降息可能会成为进一步的触发因素,到明年这个时候,比特币的价格可能会接近历史高点。
Could Bitcoin sustain above $38,000 and clear the path for a rally to $40,000, or will bears again play spoilsport?
比特币能否维持在 38,000 美元上方,并为反弹至 40,000 美元扫清道路,还是空头会再次扫兴?
Bitcoin (BTC) price analysis
比特币(BTC)价格分析
The repeated retest of a resistance level tends to weaken it. After several failed attempts, the bulls kicked the price higher on December 1st. This indicates the resumption of the uptrend.
反复重新测试阻力位往往会削弱它。经过几次失败的尝试后,多头在 12 月 1 日将价格推高。这表明上升趋势已恢复。
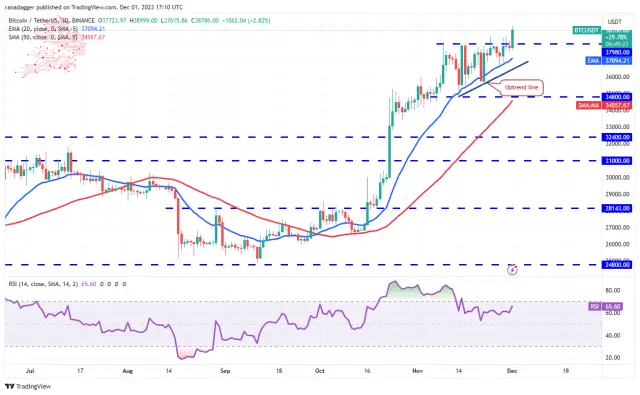
The rally above $37,980 completes an ascending triangle pattern. The BTC/USDT pair could rise to $40,000, again likely to act as a formidable resistance. If this level is scaled, the pair may reach the pattern target of $41,160. The rising moving averages and the relative strength index (RSI) above 65 indicate that bulls are in control.
反弹至 37,980 美元上方完成了上升三角形形态。 BTC/USDT 货币对可能会升至 40,000 美元,这可能再次成为强大的阻力位。如果突破该水平,该货币对可能会达到 41,160 美元的形态目标。上升的移动平均线和高于 65 的相对强弱指数 (RSI) 表明多头处于控制之中。
This optimistic view will be invalidated soon if the price turns down and dips below the uptrend line. That could invalidate the bullish setup, pulling the price down to the solid support at $34,800. A break below this level will signal that the Bears are back in the game.
如果价格下跌并跌破上升趋势线,这种乐观的看法很快就会失效。这可能会使看涨格局失效,将价格拉低至 34,800 美元的坚实支撑位。跌破该水平将标志着熊队重新回到比赛中。
Ether (ETH) price analysis
以太币(ETH)价格分析
以太币于 11 月 30 日从 20 日均线(2,019 美元)反弹,表明买家积极捍卫该水平。
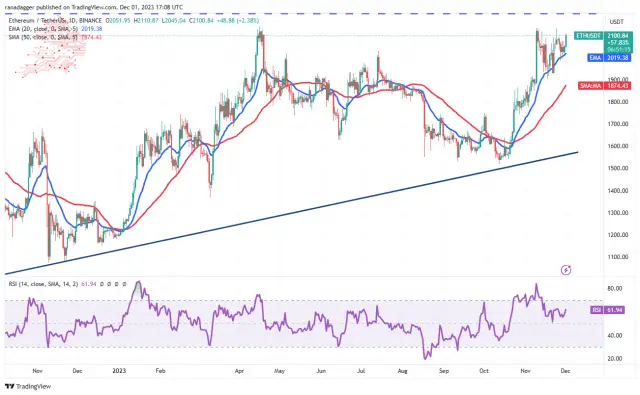
The bulls will try to push the price to the overhead resistance at $2,200. This remains the critical level to monitor in the near term. The ETH/USDT pair will complete an ascending triangle pattern if buyers bulldoze through. This bullish setup has a target objective of $3,400.
多头将试图将价格推至上方阻力位 2,200 美元。这仍然是近期需要监控的关键水平。如果买家蜂拥而至,ETH/USDT 货币对将完成上升三角形形态。这种看涨设置的目标是 3,400 美元。
The 20-day EMA is the crucial support on the downside. A break below this level will be the first sign that the bulls are losing their grip. The pair may then decline to the 50-day SMA ($1,874).
20日均线是下行的关键支撑。跌破该水平将是多头失去控制力的第一个迹象。随后该货币对可能会跌至 50 日移动平均线(1,874 美元)。
BNB price analysis
BNB价格分析
BNB has been trading inside the tight range between $223 and $239 for the past few days. This shows uncertainty among the bulls and the bears.
过去几天,BNB 一直在 223 美元至 239 美元之间的窄幅区间内交易。这表明多头和空头之间存在不确定性。
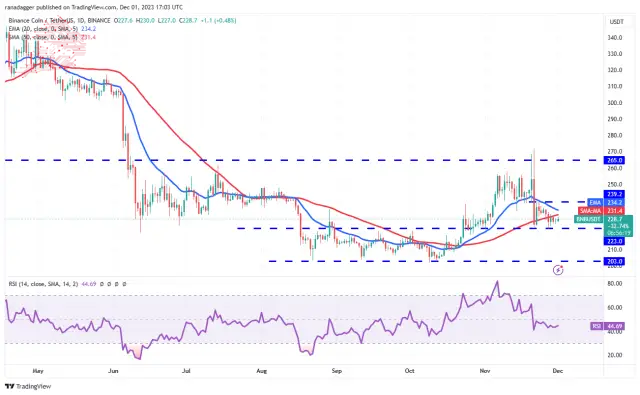
The downsloping 20-day EMA ($234) and the RSI in the negative area suggest that the bears are in command. Any recovery attempt is likely to face selling at the 20-day EMA. If the price turns down from this level, the possibility of a drop below $223 increases. That may start a decline to $203.
向下倾斜的 20 日均线(234 美元)和 RSI 处于负值区域表明空头占据主导地位。任何复苏尝试都可能面临 20 日均线的抛售。如果价格从该水平回落,跌破 223 美元的可能性就会增加。这可能会开始下跌至 203 美元。
Instead, if buyers shove the price above the 20-day EMA, the BNB/USDT pair may rise to $239. A break and close above this level could start a rally toward $265.
相反,如果买家将价格推高至 20 日均线上方,BNB/USDT 货币对可能会上涨至 239 美元。突破并收盘于该水平之上可能会开始反弹至 265 美元。
XRP price analysis
XRP has been clinging to the 20-day EMA ($0.61) for the past few days. This suggests that every minor dip is being purchased. It enhances the prospects of a break above the 20-day EMA.
XRP 价格分析 过去几天,XRP 一直紧守 20 日均线(0.61 美元)。这表明每次小幅下跌都会有人买入。它增强了突破 20 日均线的前景。
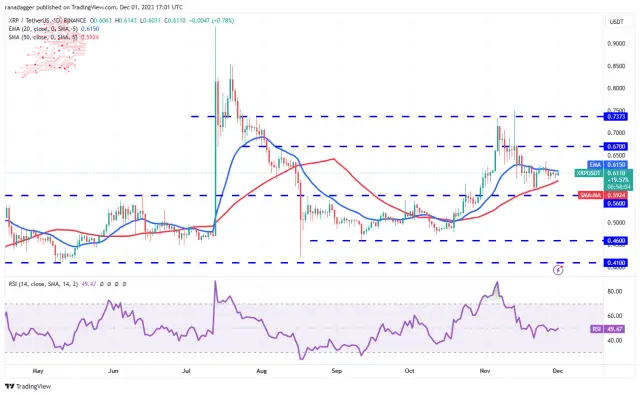
If that happens, it will suggest that the advantage has tilted toward the bulls. The XRP/USDT pair may rise to $0.64 and later to $0.67. This level may act as a minor roadblock, but the pair may touch $0.74 if overcome.
如果发生这种情况,则表明优势已向多头倾斜。 XRP/USDT 货币对可能会升至 0.64 美元,随后升至 0.67 美元。该水平可能会成为一个小障碍,但如果克服的话,该货币对可能会触及 0.74 美元。
Contrarily, if buyers fail to propel the price above the 20-day EMA, it will suggest that sellers have flipped the level into resistance. The pair may then descend to the solid support at $0.56.
相反,如果买家未能将价格推高至 20 日均线上方,则表明卖家已将该水平转为阻力位。随后该货币对可能会跌至 0.56 美元的坚实支撑位。
Solana (SOL) price analysis
Solana (SOL) 价格分析
The bears sold the rally to $62 on Nov. 29 and 30, but they could not sustain Solana below $59. This suggests buying at lower levels.
空头在 11 月 29 日至 30 日将涨势卖出至 62 美元,但他们无法将 Solana 维持在 59 美元以下。这表明在较低水平买入。
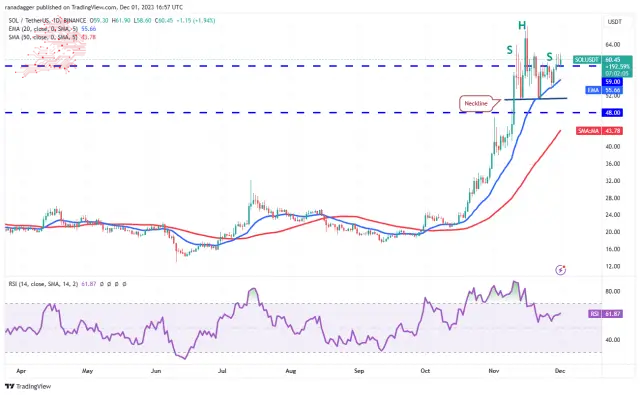
The upsloping 20-day EMA ($55.66) and the RSI in the positive territory indicate that the bulls have the upper hand. That improves the prospects of a rally above $62.10. If that happens, the SOL/USDT pair may reach $68. The bulls will have to defend this level with all their might because a break above it will clear the path for a rally to $100.
上升的 20 日均线(55.66 美元)和 RSI 处于正值区域表明多头占据上风。这改善了反弹至 62.10 美元上方的前景。如果发生这种情况,SOL/USDT 货币对可能会达到 68 美元。多头必须竭尽全力捍卫这一水平,因为突破该水平将为反弹至 100 美元扫清道路。
The immediate support to watch on the downside is the 20-day EMA. If this level cracks, the pair may tumble to $51. The bears must yank the price below this level to start a deeper correction.
下行方面值得关注的直接支撑是 20 日均线。如果该水平破裂,该货币对可能会跌至 51 美元。空头必须将价格拉至该水平以下才能开始更深层次的调整。
Cardano (ADA) price analysis
Cardano has been taking support at the 20-day EMA ($0.37), but the Bulls are struggling to start a strong rebound off it. This suggests a lack of demand at higher levels.
卡尔达诺 (ADA) 价格分析 卡尔达诺一直在 20 日均线(0.37 美元)处获得支撑,但公牛队正在努力开始强劲反弹。这表明缺乏更高水平的需求。
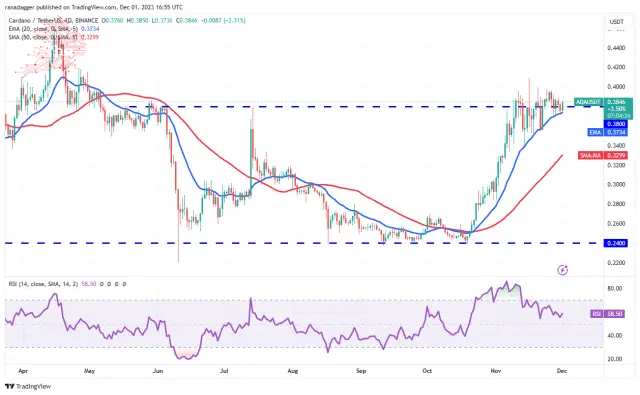
The price has been squeezed between the 20-day EMA and the overhead resistance at $0.40. The gradually upsloping 20-day EMA and the RSI above 58 indicate that bulls have an edge. If buyers pierce the overhead resistance at $0.40, the bullish momentum may pick up, and the ADA/USDT pair may jump to $0.42 and subsequently to $0.46.
价格在 20 日均线和上方阻力位 0.40 美元之间受到挤压。逐渐上升的 20 日均线和 RSI 高于 58 表明多头具有优势。如果买家突破 0.40 美元的上方阻力位,看涨势头可能会增强,ADA/USDT 货币对可能会跃升至 0.42 美元,随后升至 0.46 美元。
Contrarily, if the price skids below the 20-day EMA, it will suggest profit-booking by short-term traders. The pair may then slump to $0.34, where the bulls will try to arrest the decline.
相反,如果价格跌破20日均线,则建议短线交易者获利了结。随后该货币对可能会跌至 0.34 美元,多头将试图阻止跌势。
Dogecoin (DOGE) price analysis
狗狗币 (DOGE) 价格分析
Dogecoin has maintained above $0.08 for the past four days, indicating that the bulls are not hurrying to book profits.
过去四天,狗狗币一直维持在 0.08 美元上方,表明多头并不急于获利了结。
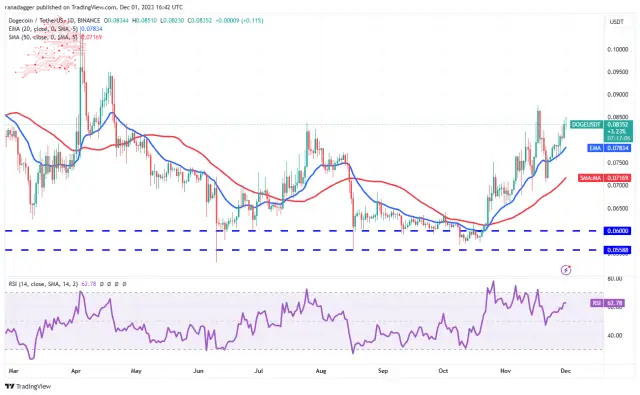
The rising 20-day EMA ($0.08) and the RSI above 62 indicate that bulls remain in command. Buyers will try to push the price to the psychological resistance of $0.10. There is a minor obstacle at $0.09, but it is likely to be crossed. Sellers are expected to mount a vigorous defence in the $0.10 to $0.11 zone.
不断上涨的 20 日均线(0.08 美元)和 RSI 高于 62 表明多头仍然占据主导地位。买家会尝试将价格推至 0.10 美元的心理阻力位。 0.09 美元有一个小障碍,但很可能会被突破。预计卖家将在 0.10 美元至 0.11 美元区域进行积极防御。
The 20-day EMA is the crucial support to watch out for on the downside. If this level gives way, the DOGE/USDT pair may drop to the 50-day SMA ($0.07).
20 日均线是下行方面值得关注的关键支撑。如果该水平失守,DOGE/USDT 货币对可能会跌至 50 日移动平均线(0.07 美元)。
Toncoin (TON) price analysis
Toncoin has been sustaining above the 20-day EMA ($2.38) for the past few days, but the up-move lacks momentum.
Toncoin (TON) 价格分析 过去几天,Toncoin 一直维持在 20 日均线(2.38 美元)之上,但上涨动力不足。
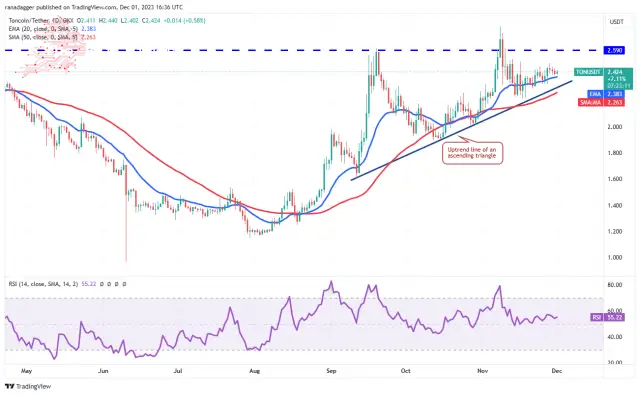
The 20-day EMA slopes gradually, and the RSI is near 55, indicating that the bulls have a slight edge. Buyers will try to propel the price above $2.59 and complete the ascending triangle pattern. This bullish setup has a target objective of $3.58.
20日均线逐渐倾斜,RSI接近55,表明多头略有优势。买家将尝试将价格推高至 2.59 美元以上,并完成上升三角形形态。这种看涨设置的目标是 3.58 美元。
On the contrary, a slide below the uptrend line will invalidate the bullish triangle pattern. The failure of a bullish setup is a bearish sign, which could drag the TON/USDT pair toward the next significant support at $1.89.
相反,跌破上升趋势线将使看涨三角形模式失效。看涨设置失败是一个看跌信号,这可能会将 TON/USDT 货币对拖向下一个重要支撑位 1.89 美元。
Chainlink (LINK) price analysis
Chainlink’s price is squeezed between the 20-day EMA ($14.19) and the overhead resistance of $15.40 for the past few days.
Chainlink (LINK) 价格分析 过去几天,Chainlink 的价格在 20 日均线(14.19 美元)和上方阻力位 15.40 美元之间受到挤压。
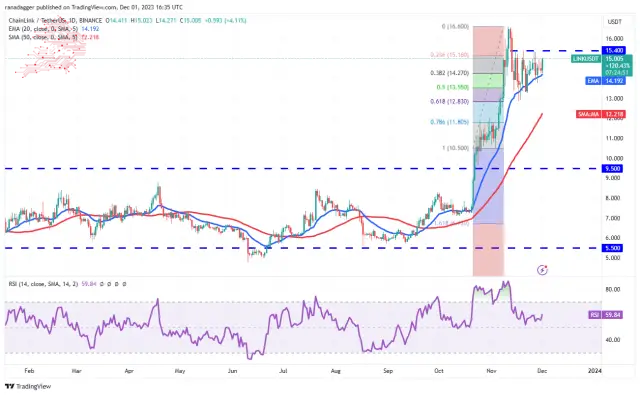
The upsloping 20-day EMA and the RSI in the positive zone indicate that the path of least resistance is to the upside. If buyers overcome the barrier at $15.40, the LINK/USDT pair could climb to $16.60 and dash toward $18.30.
向上倾斜的 20 日均线和 RSI 位于正区表明阻力最小的路径是上行。如果买家突破 15.40 美元的关口,LINK/USDT 货币对可能会攀升至 16.60 美元,并冲向 18.30 美元。
The first sign of weakness will be a break and close below the 20-day EMA. That could start a decline toward the 61.8% Fibonacci retracement level of $12.83. This level is likely to attract aggressive buying by the bulls.
疲软的第一个迹象将是跌破并收于 20 日均线下方。这可能会开始下跌至 61.8% 斐波那契回撤位 12.83 美元。这一水平可能会吸引多头的积极买盘。
Avalanche (AVAX) price analysis
Buyers pushed Avalanche above the $22 resistance on December 1st, indicating higher-level solid demand.
Avalanche (AVAX) 价格分析 12 月 1 日,买家将 Avalanche 推升至 22 美元阻力位上方,表明需求强劲。
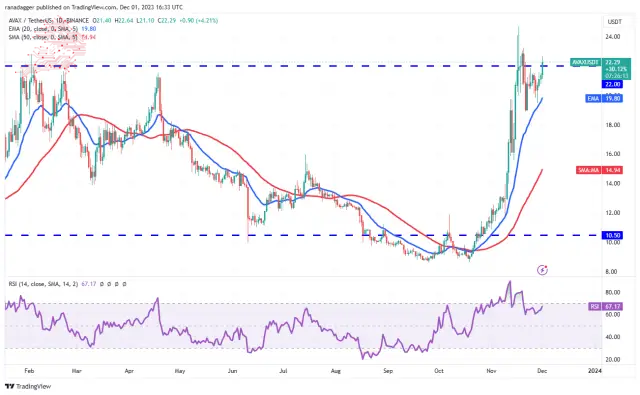
If the price closes above $22, it will increase the likelihood of a rally to $24.69. Sellers are expected to mount a vigorous defence at this level because a break above it could open the doors for a potential rally to $28.50.
如果价格收盘高于 22 美元,则上涨至 24.69 美元的可能性将增加。预计卖家将在该水平上进行积极防御,因为突破该水平可能会打开潜在反弹至 28.50 美元的大门。
Bears must quickly pull the AVAX/USDT pair back below the 20-day EMA ($19.80) if they want to halt the uptrend. That may trigger stops of several short-term traders, resulting in a drop to $18.90.
如果空头想阻止上涨趋势,他们必须迅速将 AVAX/USDT 货币对拉回到 20 日均线(19.80 美元)下方。这可能会触发一些短期交易者的止损,导致价格跌至 18.90 美元。
Source – Rakesh Upadhyay
来源——Rakesh Upadhyay
Source: https://thebittimes.com/latest-market-overview-1st-dec-btc-eth-bnb-xrp-sol-ada-doge-ton-link-avax-tbt72406.html
来源:https://thebittimes.com/latest-market-overview-1st-dec-btc-eth-bnb-xrp-sol-ada-doge-ton-link-avax-tbt72406.html


 Cryptopolitan
 DogeHome
 crypto.ro English
 Crypto News Land
 ETHNews
 CFN
CFN U_Today
 Thecoinrepublic.com


