
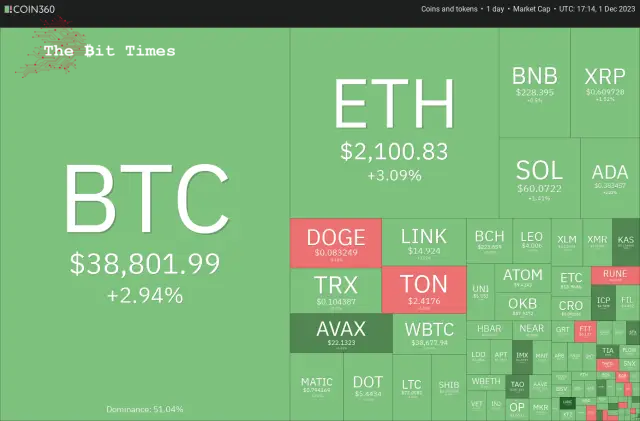
The price of Bitcoin reached a fresh high in 2023 on December 1st, and various alternative cryptocurrencies are following a similar upward trend. Could this signify the commencement of a potential Santa Claus rally in the cryptocurrency market?
비트코인 가격은 2023년 12월 1일 최고치를 경신했으며, 다양한 대체 암호화폐도 비슷한 상승 추세를 보이고 있습니다. 이것이 암호화폐 시장에서 잠재적인 산타클로스 랠리의 시작을 의미할 수 있을까요?
Bitcoin experienced a notable 9% surge in November, encountering significant resistance at the $38,000 mark. Repeated efforts by buyers to sustain prices above this level have been met with relentless resistance from bearish forces. Historically, the month of December has produced mixed results. Data from Coinglass over the last five years indicates that Bitcoin saw a notable increase only in 2020, with an impressive rise of 46.92%. This year, the bulls will aim to replicate at least a portion of that remarkable performance.
비트코인은 11월에 눈에 띄는 9% 급등을 경험했으며 38,000달러 선에서 상당한 저항에 직면했습니다. 이 수준 이상으로 가격을 유지하려는 구매자의 반복적인 노력은 약세 세력의 끊임없는 저항에 부딪혔습니다. 역사적으로 12월에는 엇갈린 결과가 나왔습니다. 지난 5년간 Coinglass의 데이터에 따르면 비트코인은 2020년에만 46.92%의 인상적인 상승률을 기록하며 눈에 띄게 증가했습니다. 올해 황소는 그 놀라운 성과의 적어도 일부를 재현하는 것을 목표로 할 것입니다.
As we approach the new year, several analysts hold an optimistic view of Bitcoin’s future. In a research note dated November 28th, Standard Chartered suggested that the potential approval of spot Bitcoin exchange-traded funds ahead of schedule could propel Bitcoin’s price to $100,000 by the conclusion of 2024.
Galaxy Digital CEO Mike Novogratz also sounded upbeat about Bitcoin while speaking to Bloomberg on November 29th. He said that the marketing team of asset managers whose ETFs are approved will try to convince people to invest in Bitcoin, which could boost adoption. Additionally, the Federal Reserve cutting rates may act as a further trigger that could send Bitcoin’s price near an all-time high by this time next year.
Galaxy Digital CEO Mike Novogratz도 11월 29일 Bloomberg와의 인터뷰에서 비트코인에 대해 낙관적인 입장을 밝혔습니다. 그는 ETF가 승인된 자산 관리자의 마케팅 팀이 사람들이 비트코인에 투자하도록 설득하여 채택을 촉진할 것이라고 말했습니다. 또한, 연준의 인하 금리는 내년 이맘때까지 비트코인 가격을 사상 최고치에 가깝게 만들 수 있는 추가 방아쇠 역할을 할 수 있습니다.
Could Bitcoin sustain above $38,000 and clear the path for a rally to $40,000, or will bears again play spoilsport?
비트코인이 38,000달러 이상을 유지하고 40,000달러까지 상승할 수 있는 길을 열어줄 수 있을까요? 아니면 곰이 다시 스포일스포츠를 하게 될까요?
Bitcoin (BTC) price analysis
The repeated retest of a resistance level tends to weaken it. After several failed attempts, the bulls kicked the price higher on December 1st. This indicates the resumption of the uptrend.
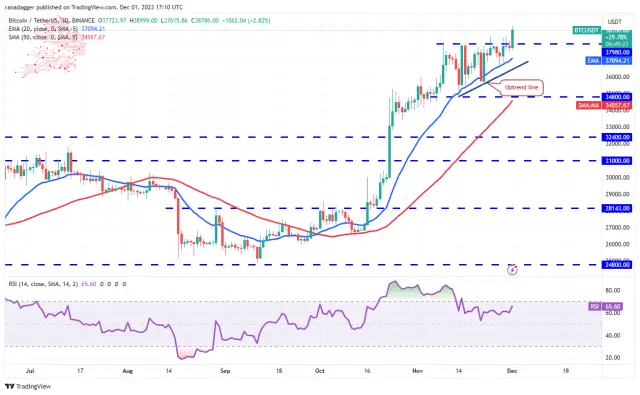
The rally above $37,980 completes an ascending triangle pattern. The BTC/USDT pair could rise to $40,000, again likely to act as a formidable resistance. If this level is scaled, the pair may reach the pattern target of $41,160. The rising moving averages and the relative strength index (RSI) above 65 indicate that bulls are in control.
This optimistic view will be invalidated soon if the price turns down and dips below the uptrend line. That could invalidate the bullish setup, pulling the price down to the solid support at $34,800. A break below this level will signal that the Bears are back in the game.
가격이 하락하고 상승 추세선 아래로 떨어지면 이러한 낙관적 전망은 곧 무효화됩니다. 이는 강세 설정을 무효화하여 가격을 34,800달러의 견고한 지지선으로 끌어내릴 수 있습니다. 이 수준 이하로 떨어지면 Bears가 게임에 다시 복귀했다는 신호입니다.
Ether (ETH) price analysis
이더(ETH) 가격 분석
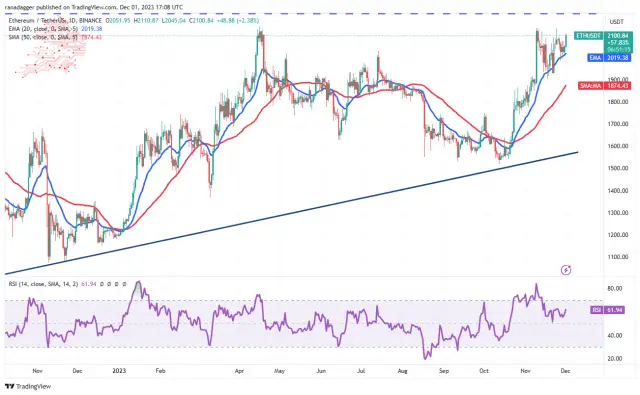
The bulls will try to push the price to the overhead resistance at $2,200. This remains the critical level to monitor in the near term. The ETH/USDT pair will complete an ascending triangle pattern if buyers bulldoze through. This bullish setup has a target objective of $3,400.
강세론자들은 가격을 2,200달러의 머리 위 저항선까지 끌어올리려고 노력할 것입니다. 이는 단기적으로 모니터링해야 할 중요한 수준으로 남아 있습니다. 구매자가 밀어붙이면 ETH/USDT 쌍은 상승 삼각형 패턴을 완성합니다. 이 강세 설정의 목표 목표는 $3,400입니다.
The 20-day EMA is the crucial support on the downside. A break below this level will be the first sign that the bulls are losing their grip. The pair may then decline to the 50-day SMA ($1,874).
20일 EMA는 하락세를 뒷받침하는 중요한 지지선입니다. 이 수준 아래로 하락하는 것은 상승세가 힘을 잃고 있다는 첫 번째 신호가 될 것입니다. 그러면 해당 쌍은 50일 SMA($1,874)로 하락할 수 있습니다.
BNB price analysis
BNB 가격 분석
BNB has been trading inside the tight range between $223 and $239 for the past few days. This shows uncertainty among the bulls and the bears.
BNB는 지난 며칠 동안 223달러에서 239달러 사이의 좁은 범위 내에서 거래되었습니다. 이는 황소와 곰 사이의 불확실성을 보여줍니다.
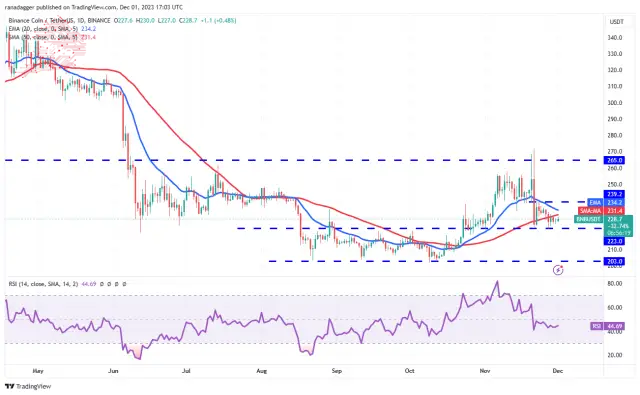
The downsloping 20-day EMA ($234) and the RSI in the negative area suggest that the bears are in command. Any recovery attempt is likely to face selling at the 20-day EMA. If the price turns down from this level, the possibility of a drop below $223 increases. That may start a decline to $203.
하락세를 보이는 20일 EMA($234)와 마이너스 영역의 RSI는 하락세를 주도하고 있음을 나타냅니다. 모든 회복 시도는 20일 EMA에서 매도될 가능성이 높습니다. 가격이 이 수준에서 하락하면 $223 이하로 하락할 가능성이 높아집니다. 그러면 $203까지 하락이 시작될 수 있습니다.
Instead, if buyers shove the price above the 20-day EMA, the BNB/USDT pair may rise to $239. A break and close above this level could start a rally toward $265.
XRP price analysis
XRP has been clinging to the 20-day EMA ($0.61) for the past few days. This suggests that every minor dip is being purchased. It enhances the prospects of a break above the 20-day EMA.
XRP 가격 분석 XRP는 지난 며칠 동안 20일 EMA($0.61)를 고수해 왔습니다. 이는 모든 사소한 딥이 구매되고 있음을 의미합니다. 이는 20일 EMA를 넘어설 가능성을 높여줍니다.
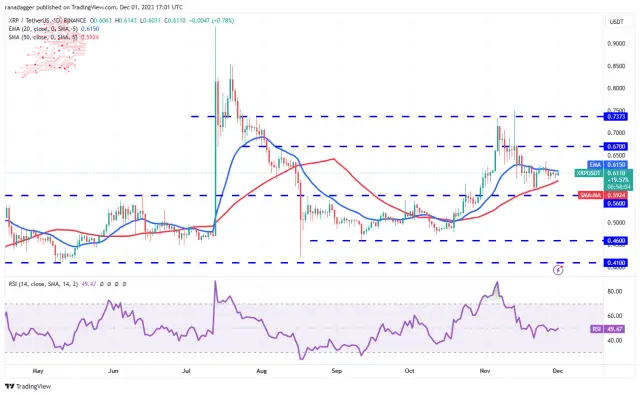
If that happens, it will suggest that the advantage has tilted toward the bulls. The XRP/USDT pair may rise to $0.64 and later to $0.67. This level may act as a minor roadblock, but the pair may touch $0.74 if overcome.
Contrarily, if buyers fail to propel the price above the 20-day EMA, it will suggest that sellers have flipped the level into resistance. The pair may then descend to the solid support at $0.56.
반대로, 구매자가 20일 EMA 이상으로 가격을 끌어올리지 못하면 판매자가 저항 수준으로 전환했음을 의미합니다. 그런 다음 해당 쌍은 $0.56의 견고한 지지선으로 내려갈 수 있습니다.
Solana (SOL) price analysis
솔라나(SOL) 가격 분석
The bears sold the rally to $62 on Nov. 29 and 30, but they could not sustain Solana below $59. This suggests buying at lower levels.
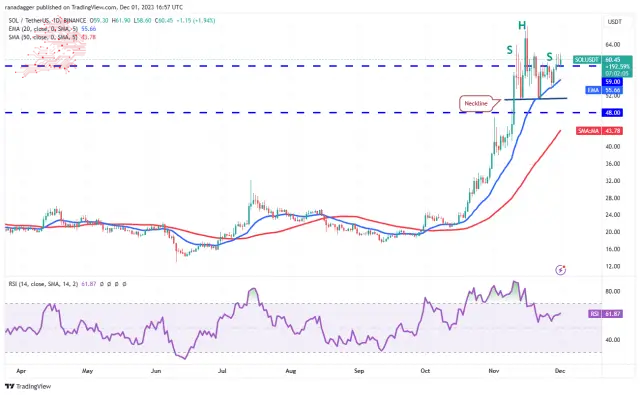
The upsloping 20-day EMA ($55.66) and the RSI in the positive territory indicate that the bulls have the upper hand. That improves the prospects of a rally above $62.10. If that happens, the SOL/USDT pair may reach $68. The bulls will have to defend this level with all their might because a break above it will clear the path for a rally to $100.
상승하는 20일 EMA($55.66)와 플러스 영역의 RSI는 황소가 우위를 점하고 있음을 나타냅니다. 이는 $62.10 이상의 랠리 전망을 향상시킵니다. 그렇게 되면 SOL/USDT 쌍은 $68에 도달할 수 있습니다. 강세론자들은 이 수준을 넘어서면 100달러까지 상승할 수 있는 길을 열어주기 때문에 이 수준을 온 힘을 다해 방어해야 할 것입니다.
The immediate support to watch on the downside is the 20-day EMA. If this level cracks, the pair may tumble to $51. The bears must yank the price below this level to start a deeper correction.
하락세를 관찰할 수 있는 즉각적인 지지선은 20일 EMA입니다. 이 수준이 깨지면 통화쌍은 51달러까지 하락할 수 있습니다. 하락세는 더 깊은 조정을 시작하기 위해 가격을 이 수준 아래로 끌어내려야 합니다.
Cardano (ADA) price analysis
Cardano has been taking support at the 20-day EMA ($0.37), but the Bulls are struggling to start a strong rebound off it. This suggests a lack of demand at higher levels.
Cardano(ADA) 가격 분석 Cardano는 20일 EMA($0.37)에서 지지를 받아왔지만 Bulls는 강력한 반등을 시작하기 위해 고군분투하고 있습니다. 이는 더 높은 수준에서는 수요가 부족하다는 것을 의미합니다.
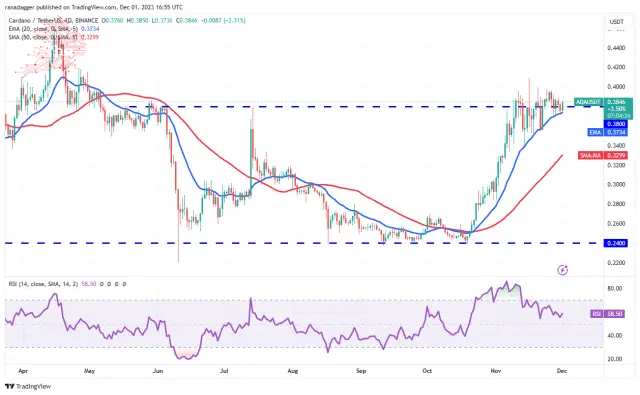
The price has been squeezed between the 20-day EMA and the overhead resistance at $0.40. The gradually upsloping 20-day EMA and the RSI above 58 indicate that bulls have an edge. If buyers pierce the overhead resistance at $0.40, the bullish momentum may pick up, and the ADA/USDT pair may jump to $0.42 and subsequently to $0.46.
Contrarily, if the price skids below the 20-day EMA, it will suggest profit-booking by short-term traders. The pair may then slump to $0.34, where the bulls will try to arrest the decline.
반대로 가격이 20일 EMA 아래로 하락하면 단기 트레이더의 이익 예약을 제안합니다. 그런 다음 쌍은 $0.34까지 하락할 수 있으며, 상승세는 하락을 막으려고 노력할 것입니다.
Dogecoin (DOGE) price analysis
도지코인(DOGE) 가격 분석
Dogecoin has maintained above $0.08 for the past four days, indicating that the bulls are not hurrying to book profits.
Dogecoin은 지난 4일 동안 0.08달러 이상을 유지했는데, 이는 상승세가 서두르지 않고 이익을 기록하고 있음을 나타냅니다.
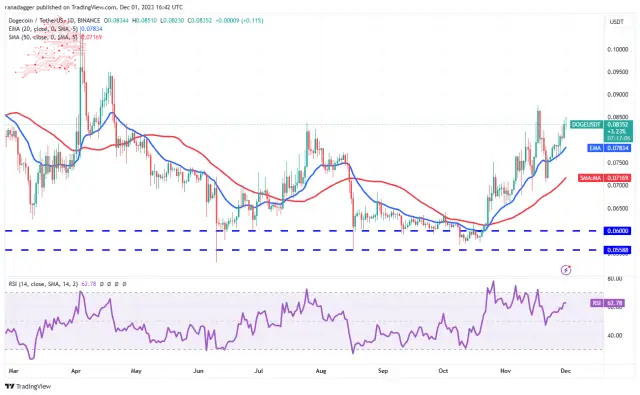
The rising 20-day EMA ($0.08) and the RSI above 62 indicate that bulls remain in command. Buyers will try to push the price to the psychological resistance of $0.10. There is a minor obstacle at $0.09, but it is likely to be crossed. Sellers are expected to mount a vigorous defence in the $0.10 to $0.11 zone.
상승하는 20일 EMA($0.08)와 62 이상의 RSI는 강세장이 여전히 우위를 점하고 있음을 나타냅니다. 구매자는 가격을 심리적 저항인 $0.10까지 끌어올리려고 노력할 것입니다. 0.09달러에 작은 장애물이 있지만 넘어갈 가능성이 높습니다. 판매자는 $0.10~$0.11 영역에서 강력한 방어를 펼칠 것으로 예상됩니다.
The 20-day EMA is the crucial support to watch out for on the downside. If this level gives way, the DOGE/USDT pair may drop to the 50-day SMA ($0.07).
20일 EMA는 하락세에 주의해야 할 중요한 지지선입니다. 이 수준이 무너지면 DOGE/USDT 쌍은 50일 SMA($0.07)로 떨어질 수 있습니다.
Toncoin (TON) price analysis
Toncoin has been sustaining above the 20-day EMA ($2.38) for the past few days, but the up-move lacks momentum.
Toncoin(TON) 가격 분석 Toncoin은 지난 며칠 동안 20일 EMA($2.38) 이상을 유지해 왔지만 상승세에는 모멘텀이 부족합니다.
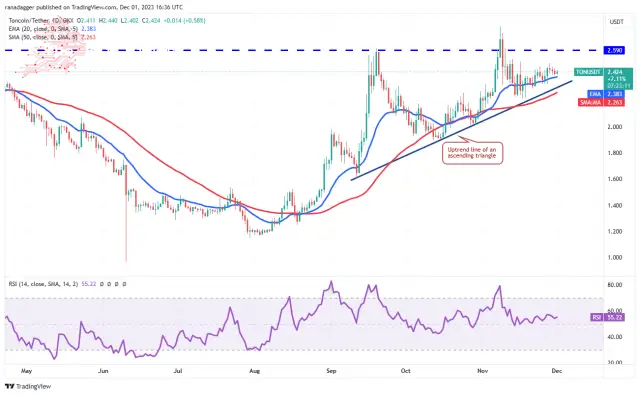
The 20-day EMA slopes gradually, and the RSI is near 55, indicating that the bulls have a slight edge. Buyers will try to propel the price above $2.59 and complete the ascending triangle pattern. This bullish setup has a target objective of $3.58.
20일 EMA는 점진적으로 기울어지고 RSI는 55에 가까워 상승세가 약간 우위에 있음을 나타냅니다. 구매자는 가격을 $2.59 이상으로 끌어올리고 상승 삼각형 패턴을 완성하려고 노력할 것입니다. 이 강세 설정의 목표 목표는 $3.58입니다.
On the contrary, a slide below the uptrend line will invalidate the bullish triangle pattern. The failure of a bullish setup is a bearish sign, which could drag the TON/USDT pair toward the next significant support at $1.89.
Chainlink (LINK) price analysis
Chainlink’s price is squeezed between the 20-day EMA ($14.19) and the overhead resistance of $15.40 for the past few days.
Chainlink(LINK) 가격 분석 Chainlink의 가격은 20일 EMA($14.19)와 지난 며칠 동안의 오버헤드 저항인 $15.40 사이에서 압박을 받고 있습니다.
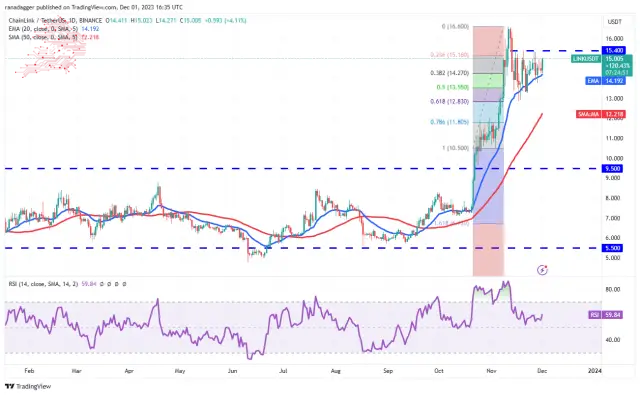
The upsloping 20-day EMA and the RSI in the positive zone indicate that the path of least resistance is to the upside. If buyers overcome the barrier at $15.40, the LINK/USDT pair could climb to $16.60 and dash toward $18.30.
상승하는 20일 EMA와 플러스 영역의 RSI는 저항이 가장 적은 경로가 상승세임을 나타냅니다. 구매자가 $15.40의 장벽을 극복하면 LINK/USDT 쌍은 $16.60까지 상승하여 $18.30을 향해 돌진할 수 있습니다.
The first sign of weakness will be a break and close below the 20-day EMA. That could start a decline toward the 61.8% Fibonacci retracement level of $12.83. This level is likely to attract aggressive buying by the bulls.
Avalanche (AVAX) price analysis
Buyers pushed Avalanche above the $22 resistance on December 1st, indicating higher-level solid demand.
Avalanche(AVAX) 가격 분석 구매자는 12월 1일에 Avalanche를 22달러 저항선 위로 밀면서 더 높은 수준의 탄탄한 수요를 나타냈습니다.
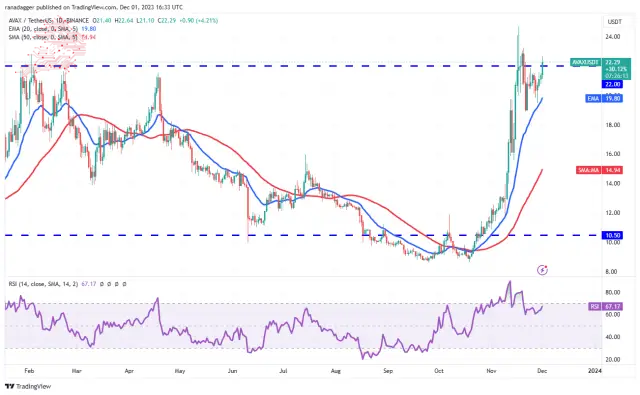
If the price closes above $22, it will increase the likelihood of a rally to $24.69. Sellers are expected to mount a vigorous defence at this level because a break above it could open the doors for a potential rally to $28.50.
가격이 22달러 이상으로 마감되면 랠리 가능성이 24.69달러로 높아집니다. 이 수준을 돌파하면 $28.50까지 상승할 수 있는 문이 열릴 수 있기 때문에 판매자들은 이 수준에서 강력한 방어를 펼칠 것으로 예상됩니다.
Bears must quickly pull the AVAX/USDT pair back below the 20-day EMA ($19.80) if they want to halt the uptrend. That may trigger stops of several short-term traders, resulting in a drop to $18.90.
상승세를 멈추려면 하락세가 AVAX/USDT 쌍을 20일 EMA($19.80) 아래로 빠르게 끌어내려야 합니다. 이로 인해 여러 단기 거래자가 중단되어 $18.90까지 하락할 수 있습니다.
Source – Rakesh Upadhyay
Source: https://thebittimes.com/latest-market-overview-1st-dec-btc-eth-bnb-xrp-sol-ada-doge-ton-link-avax-tbt72406.html
출처: https://thebittimes.com/latest-market-overview-1st-dec-btc-eth-bnb-xrp-sol-ada-doge-ton-link-avax-tbt72406.html


 Crypto News Land
 ETHNews
 CFN
CFN U_Today
 Thecoinrepublic.com
 DogeHome
 Optimisus
 Optimisus
 DeFi Planet


